
For the October product update, we chose to highlight a new feature, Remote Access Debugger, and some major improvements that we’ve shipped to the Metadata View.
Remote Access Debugger
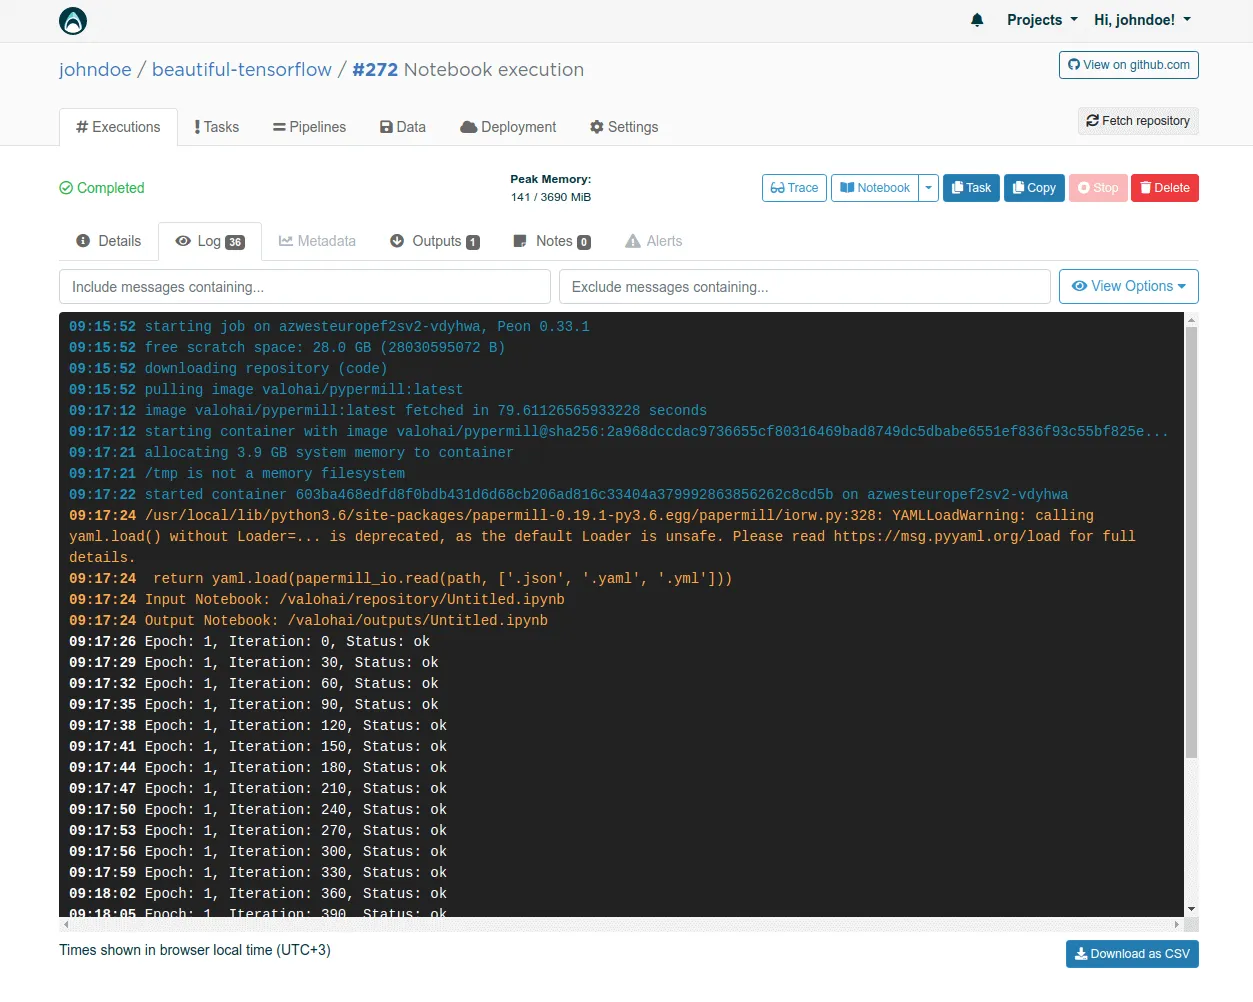
Valohai offers plenty of information about the remote execution via logging and metadata. The iteration cycle for re-running a job with extra debugging printouts is smooth and usually enough to get you out of trouble. In other words, one doesn’t (and shouldn’t) need to connect straight into the live worker machine very often. But sometimes you need to.
Sometimes we can only reproduce the problem in particular circumstances. It could be that a specific cloud instance type has a unique GPU that reproduces the error. Maybe a specific driver combined with a specific version of the Tensorflow crash the memory. Or perhaps you suspect that your favorite JSON file is no longer in the folder that it absolutely should be. These are the sort of conspiracy theories that emerge after nine hours of fierce debugging. Is the logger lying? Is the Linux kernel trolling me?! Sometimes one just has to “physically” go and triple-check to safeguard the remains of their sanity. In the age of cloud computing, an SSH connection is the best thing we have for eyeballing bugs in their natural habitat.
Debugging in Valohai
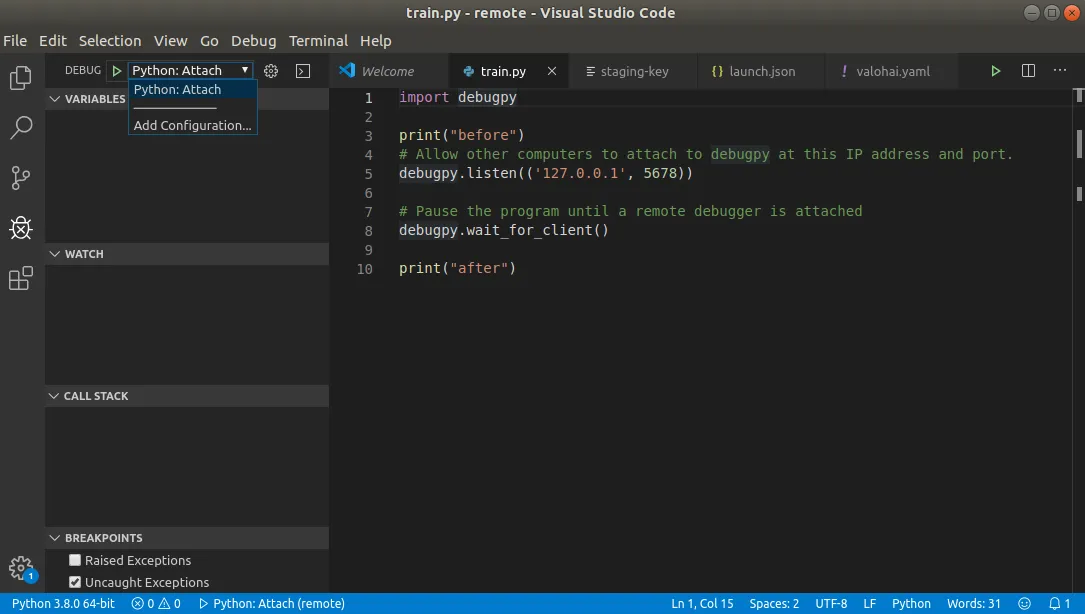
One of Valohai’s core designs principles is technology agnosticism. Valohai aims to support all the frameworks, programming languages, IDEs, and widgets out there. SSH is a low-level technology that offers safe access to a remote computer and doesn’t care if you want to debug c++, Python, or the Unity game engine. Nor does it care if you are using VSCode, PyCharm, or your favorite Emacs build v20.3 from the summer of ‘98.
When starting a new job, users choose to enable the SSH server inside the container and offer the public key used for the connection.
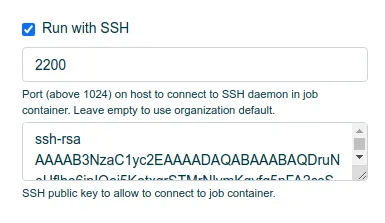
Once the machine has started, it logs out the SSH command required to connect to the instance, and that’s it. After that, the world is your oyster. You can send one-off terminal commands, open an interactive shell or an SSH tunnel for your favorite debuggers like VSCode or PyCharm.

Improvements to the Metadata View
Valohai tracks all the metrics you print in the metadata view. The view includes charts that help you visualize and compare experiments
We’ve seen our users run increasingly large-scale experiments and with that our previous chart library has become inadequate (RIP 💀). So we’ve upgraded the library to Plotly.js to become more performant and scalable for massive hyperparameter sweeps and other experiments with large amounts of data points. The chart library also includes better controls for editing the view (zoom, pan, etc.). We’re also adding adjustable smoothing for the line chart.
In addition to the new and improved charting, we’ve added quick statistics for the metrics you select to view. These stats include sum, average, median, min, max, p10, p90, p95, and p99 values.
Thanks to all the users who’ve requested improvements to the metadata view. If you have more suggestions or feedback, please reach out to me or your customer success rep.