What Is Model Monitoring?
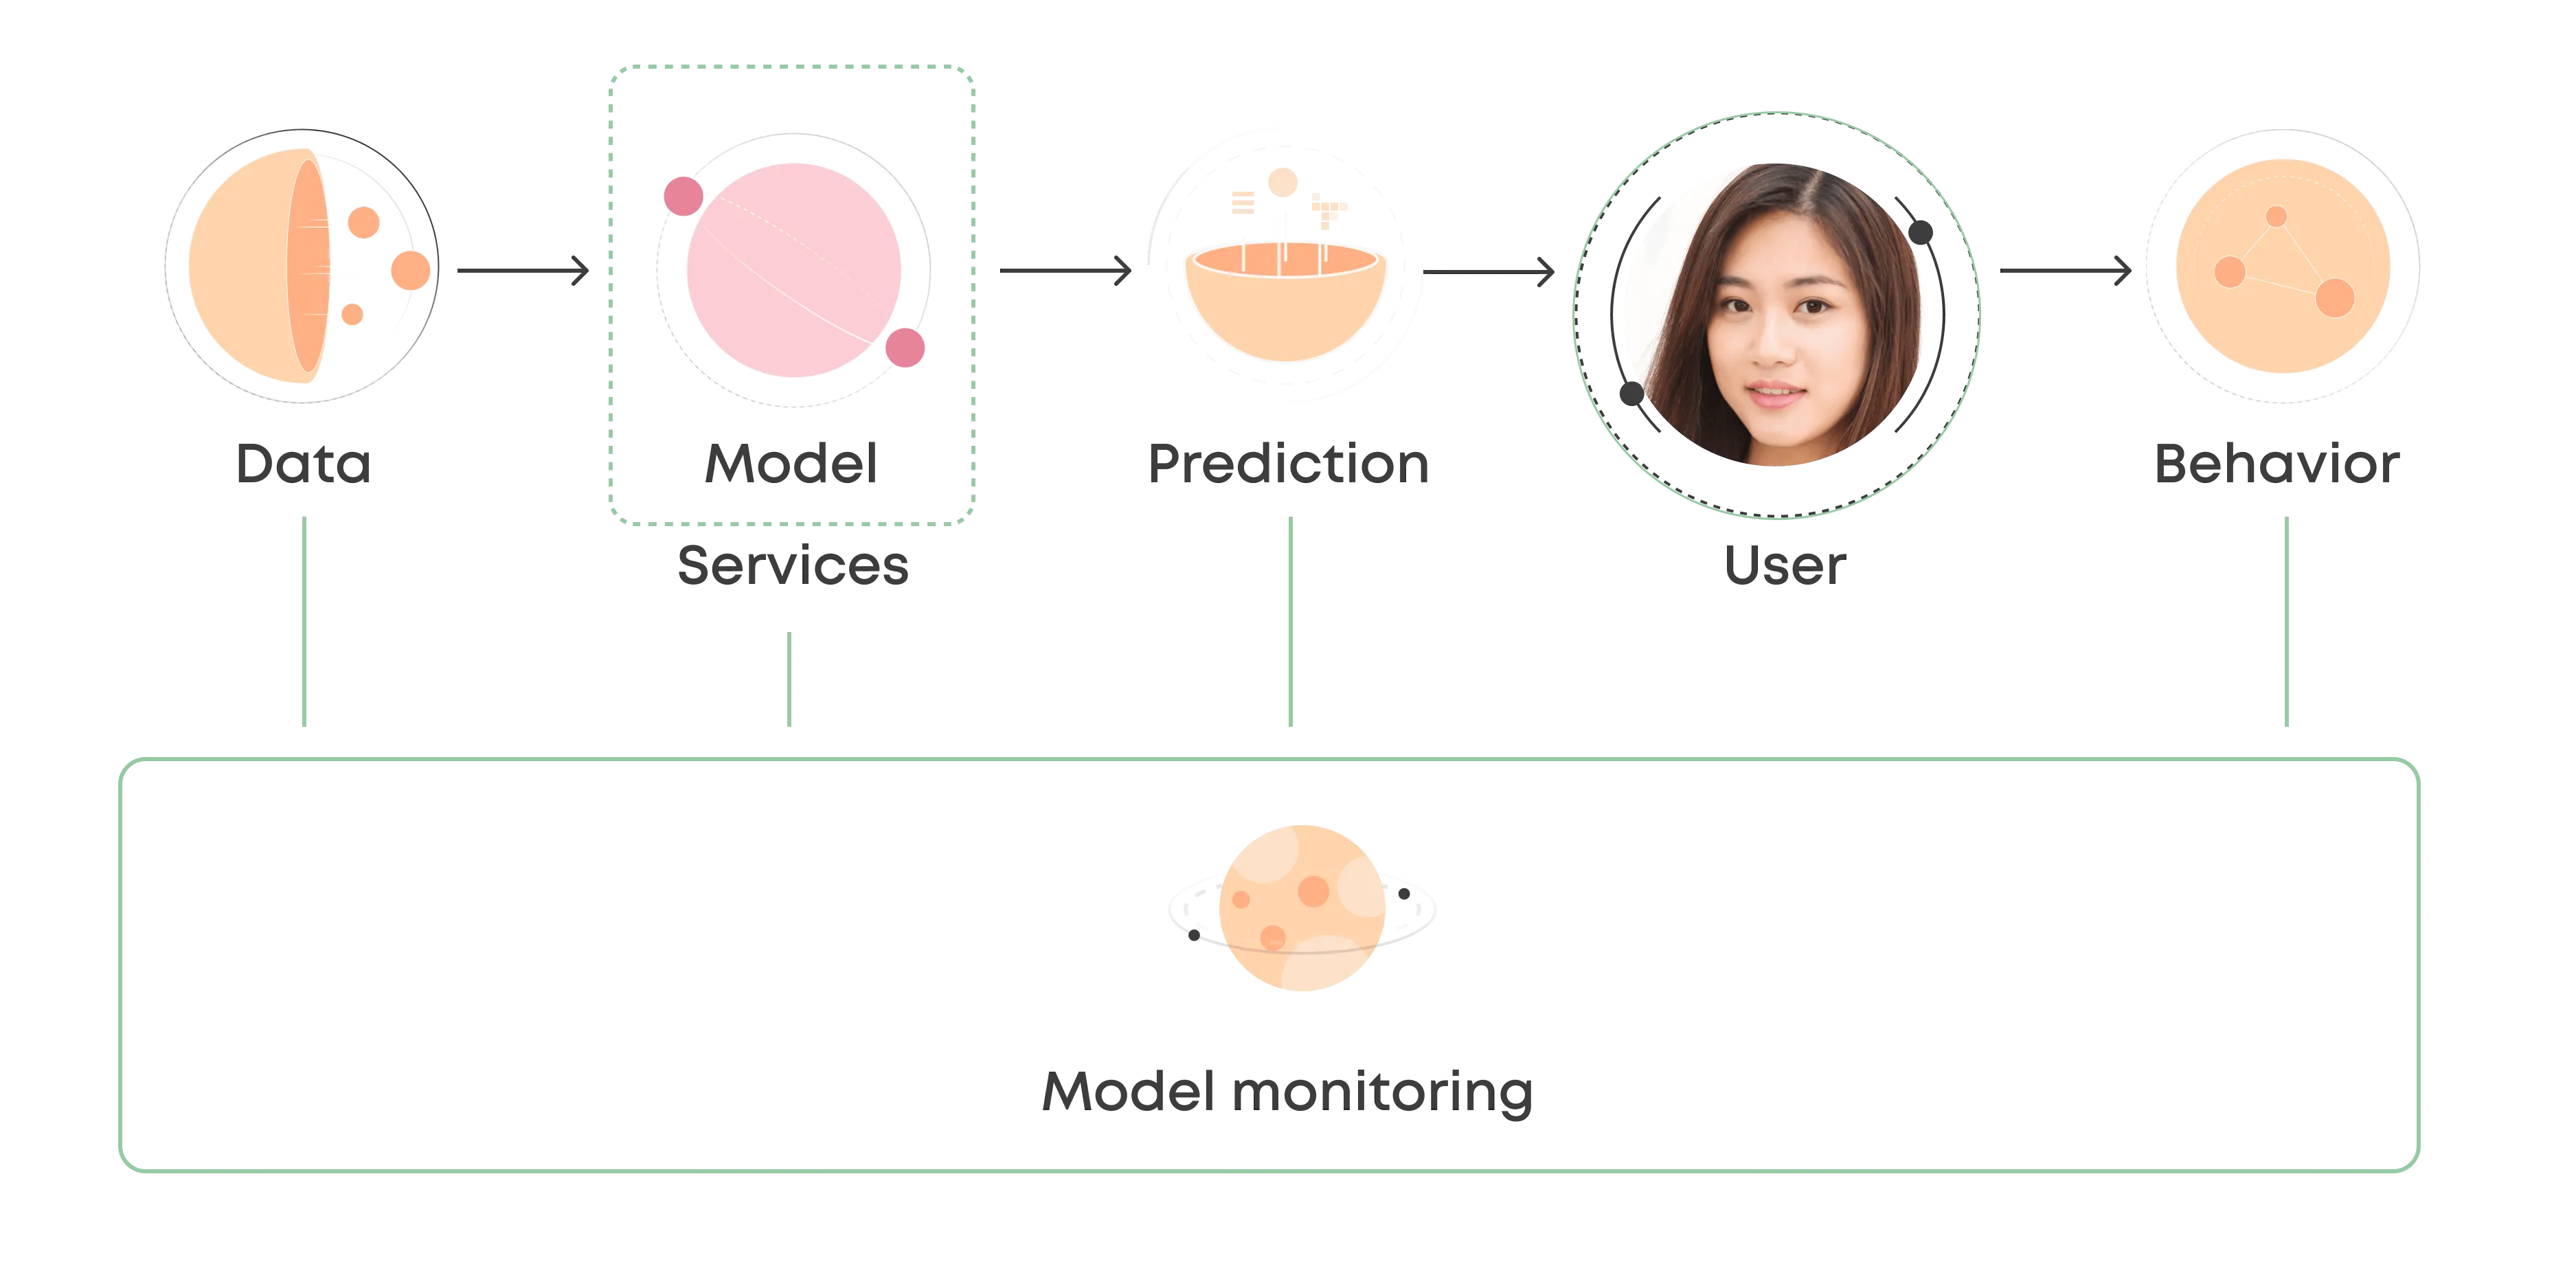
Model monitoring refers to the process of closely tracking the performance of machine learning models in production. It enables your AI team to identify and eliminate a variety of issues, including bad quality predictions and poor technical performance. As a result, your machine learning models deliver the best performance.
Monitoring models effectively is very important for making your machine learning service successful. It enables you to create a major impact in the real world. But what should you track while monitoring models? In this post, you will find all the details.
Why Should You Monitor Your Models?
There are many reasons for monitoring machine learning models. It enables you to analyze the accuracy of the prediction, eliminate prediction errors, and tweak the models to ensure the best performance.
Eliminate Poor Generalization
Due to the lack of labeled data or other computational constraints, a machine learning model is usually trained on a small subset of the total in-domain data. Even though the model is constructed to reduce the bias, the practice leads to poor generalization. As a result, the output data sample will be inaccurate or inefficient. Monitoring models can fix this issue. It helps you to create balanced and accurate models without overfitting or underfitting the data.
Eliminate the Issue of Changing Parameters Over Time
A model is optimized based on the variables and parameters of a specific time. The same parameters will become insignificant by the time of deploying the model. For example, a sentiment model created 5 years ago may falsely classify the sentiment of certain words or phrases. So, the prediction will be inaccurate. Model monitoring enables you to fix the issue by helping you to analyze how a model performs on real-world data over a long period.
Ensuring the Stability of Prediction
The input of machine learning models is not independent. So, changes in any part of the system, including hyper-parameters and sampling methods, can cause unpredictable changes. Model monitoring ensures a highly stable prediction by tracking various stability metrics, including Population Stability Index (PSI) and Characteristic Stability Index (CSI).
Machine Learning Model Checklist: What Should You Track?
You should keep a close eye on these things to make your machine learning model successful in real life:
1. Data Distribution Shifts
Every machine learning model degrades over time. You might experience data drift while making a change in the model input. When the model receives data that it has not seen in training, the performance can degrade significantly. Model monitoring helps you to identify performance-related issues effectively.
Let's think about the tough situation created by the pandemic. It has affected the behaviors of the customers significantly, as many people have lost their jobs. As a result, their response to the marketing campaign is quite different from the previous years.
That's why it's important to get early signals on the change in data distribution. So, you can update the models accordingly. By monitoring models, you can track the distributions for the key model features and the model prediction. If the shift of data distribution significantly differs from the past, you can trigger an alert for making necessary updates to the model.
2. Performance Shifts
Model monitoring helps you to track performance shifts. As a result, you can determine how well the model performs. Also, it helps you to understand how to debug effectively if something goes wrong.
The most straightforward way to track the shift is constantly evaluating the performance on real-world data. You can compare the predictions to the actual values to determine whether the model works well or not. Also, you can trigger customized notifications for getting information about any significant change in the metrics, like accuracy and precision.
3. Health/Operation Metrics
You need to keep a close eye on the system performance, including the usage of CPU, memory, disk, and network I/O. Analyzing these metrics is very significant for ensuring that the machine learning service is fully operational.
Health metrics come built-in with Valohai deployments. There are also various tools, like Grafana, that you can use to track the health of the machine learning system. They allow you to query and visualize the metric conveniently. Also, you can define alert rules for the most important metrics.
4. Data Integrity
Data integrity refers to the reliability of data throughout its lifecycle. You must ensure that the data is accurate. There are various ways to do it, including error checking and validation.
You have to check errors in data distribution, feature statistics, and correlations to ensure integrity. There are different tools available to help you. For example, Great Expectations, to promote analytic integrity for the data pipelines. It tests, documents, and profiles your data pipelines as part of your traditional Continuous Integration (CI) workflows. Checking data integrity in this way can save you a lot of time.
5. Performance by Segment
Tracking performance by segment enables you to get a deep understanding of the model quality on specific slices. It helps you to find critical areas, like where the machine learning model makes mistakes and where it performs the best.
You might have already defined segments to monitor, like model accuracy for the premium customers versus the overall consumers of a business. To track the performance by segment, you will need a custom quality metric only for the object inside the defined segment.
Also, you should look for low-performance segments. Let's think about a scenario where you are working on a vehicle pricing model. If it constantly suggests higher than actual quotes in a specific region, you should take a note of it and find a solution to improve the accuracy.
6. Bias/Fairness
Monitoring bias ensures that all sub-groups and track compliances have received fair treatment. It's a very important factor in critical areas, like healthcare and finance, where model decisions might have serious implications.
As a creator of the model, you must be aware of the performance variation in different circumstances. For example, the model performance of different demographic groups might vary in terms of their representation in the training data. You can fix this issue by utilizing different tools available online.
Wrapping Up
Model monitoring is becoming a core component of successful applications of machine learning in production. The checklist above will provide valuable considerations in implementing thorough model monitoring that ensures consistent performance in production.
Monitoring a Model in Valohai
Valohai is an unopinionated MLOps platform. It focuses on offering an infrastructure to collect, version, and visualize any metric imaginable now and in the future. It is ultimately up to the data scientist to figure out which metrics are worthwhile and how to calculate them for each model.
The model in production communicates with Valohai on the operating system level, which means that it collects and stores everything your process internally prints out, whether it is an error stack trace, model metric, or health information.
Step 1: Storing metrics
Once the user has chosen which metrics are worth tracking and how to calculate them, it is time to expose them to the platform.
Valohai always stores all the raw logs, but in order to separate metrics from the rest, they need to be printed
out as a JSON dictionary with a special key vh_metadata. Valohai offers a Python utility to make
this easier, but experts can print raw JSON too.
Example code:
c = calculate_response_confidence()

# Stored as a raw log
print(f"Confidence: {c}")

# Stored as a metric
print("{'vh_metadata': {'confidence': c}}")

# Stored as a metric (alternative)
import valohai
logger = valohai.logger()
logger.log("confidence", c)
Step 2: Visualizing metrics in the UI
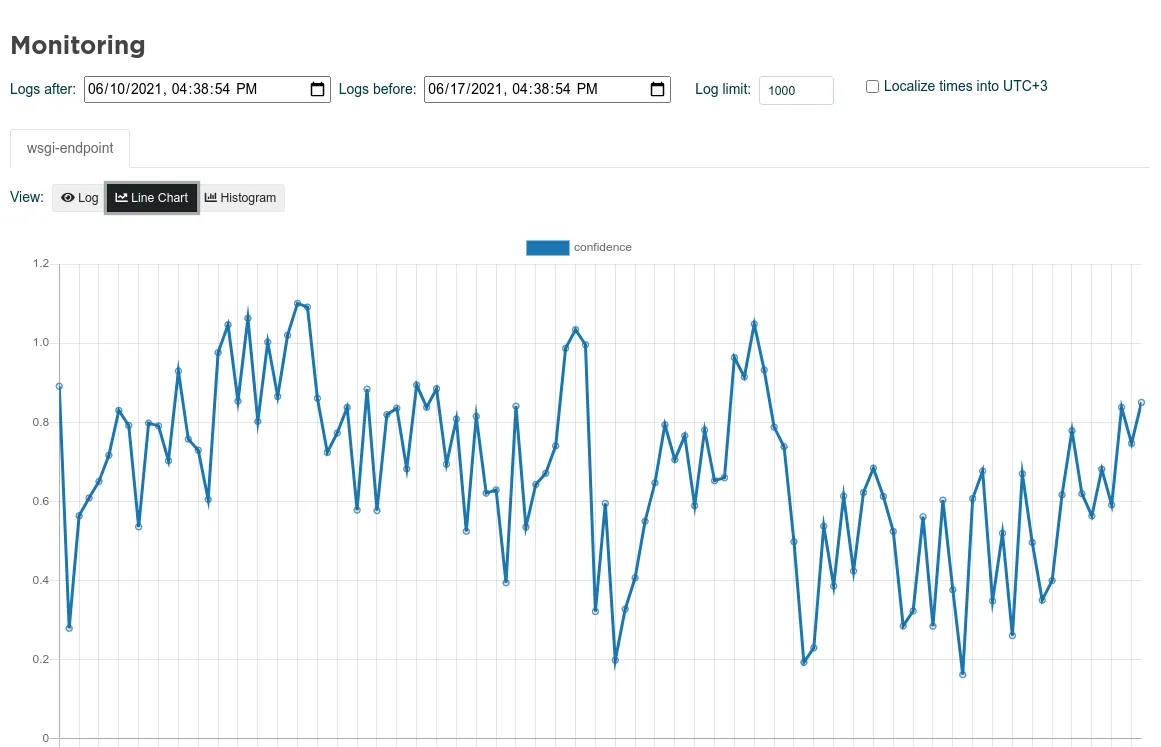
Once the metric is parsed from the raw logs by Valohai, it can be visualized over time using the Valohai deployment monitoring UI, where users can analyze the logs and metrics for any chosen time range.
The three different monitoring views:
- Logs
- Line Chart
- Histogram
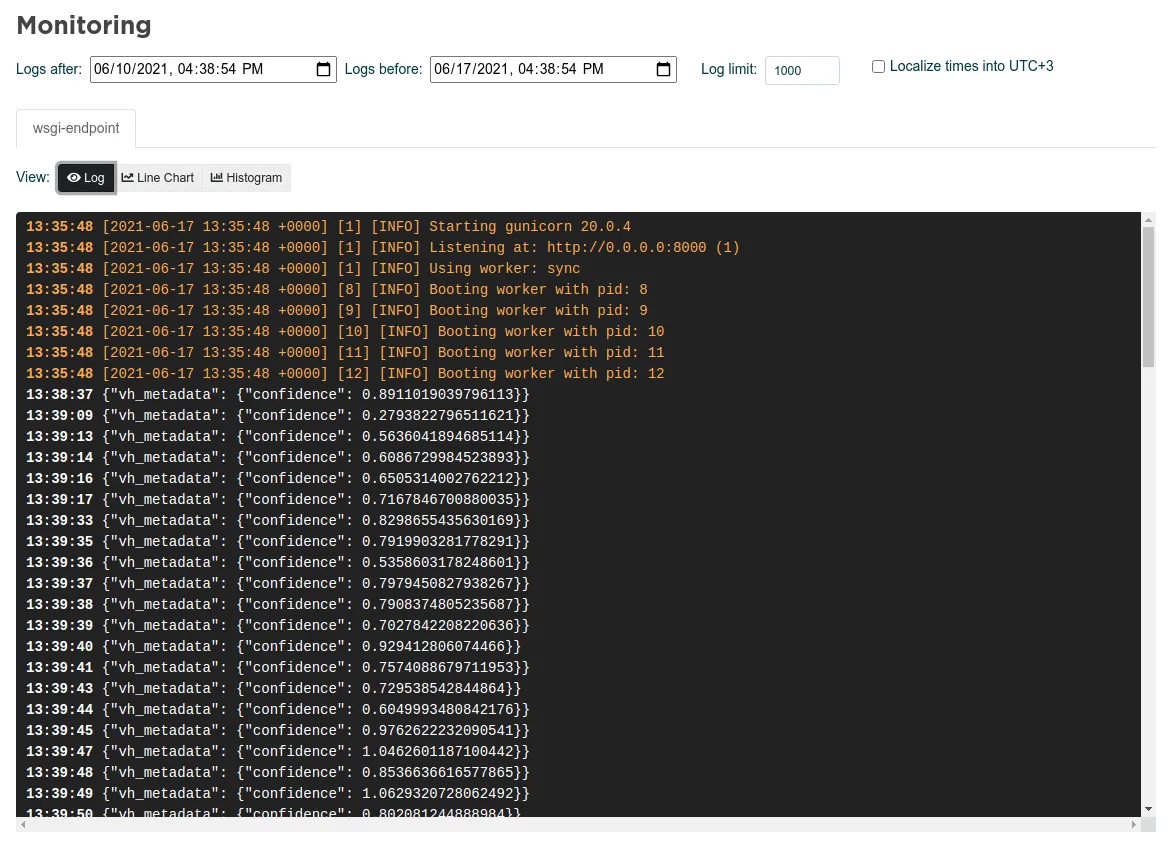
In the logs view, the user can monitor the raw logs for the chosen time range. Things printed to stdout and stderr are differently colored for convenience and the timestamp is naturally handled by the platform automatically. This view is mainly for debugging purposes.
The histogram is aggregating data for the chosen time step with Count, Min, Max, Mean, and Sum to get a better understanding of the long term drifting and anomalies.
The best of the best

MLOps in the Wild
A collection of MLOps case studiesSkimmable. Inspirational.
The MLOps space is still in its infancy and how solutions are applied varies case by case. We felt that we could help by providing examples of how companies are working with tooling to propel their machine learning capabilities.
Think of this as a lookbook for machine learning systems. You might find something that clicks and opens up exciting new avenues to organize your work – or even build entirely new types of products.
Download