Imagine that magical day when your machine learning model is in production. It is possibly integrated into end-user applications, serving predictions and providing real-world value. As a Data Scientist, You may think that your job is done and that you can move on to the next problem to be solved. Unfortunately, the work is just getting started.
What works today might not work tomorrow. And when a model is in real-world use, serving the faulty predictions can lead to catastrophic consequences like what happened with Zillow and their iBuying algorithm which caused the company to overpay for real estate and ultimately, lay off 25% of their workforce.
Data changes; maybe your model(s) are updated automatically. You have no way of checking if everything is the way it should be without observing these things. So we introduce another layer of ML in production - Observability.
Observability is the collection of statistics, performance data, and metrics from every part of your ML system. Metadata, if you will.
We will dig into how we can easily get started with observability and detect data drift using whylogs while executing your pipeline on Valohai.
Example of logging shark-attacks drift
Valohai’s MLOps platform can execute machine learning pipelines with any custom code. Due to its customizability, integrating any observability tools such as WhyLabs is as simple as any other step in your pipeline.
Let’s take a look at an example, built on a recent post on shark attacks, and let’s see how tracking your incoming dataset could look like!
We will use the whylogs open-source data logging library. The library allows you to profile your dataset with a few simple lines. Profiling creates a statistical summary of a dataset, which can be used like a log of the data. This in turn can be visualized locally with whylogs or sent to the WhyLabs platform, as we’ll do in this example.
First, you need to sign up for a WhyLabs account Starter edition, a free tier that allows users to access all of the features of the WhyLabs AI observability platform. The signup process will guide you through the API key setting etc. Then you add the logging functionality to your code.
from whylogs.app import Session
from whylogs.app.writers import WhyLabsWriter

#insert your key OR scratch this if using env vars at valohai
os.environ["WHYLABS_API_KEY"] = YOU_SECRECT
# insert your org code OR scratch this if using env vars at valohai
os.environ["WHYLABS_DEFAULT_ORG_ID"] = YOUR_ORG_CODE

# Adding the WhyLabs Writer to utilize WhyLabs platform
writer = WhyLabsWriter("", formats=[])
We set the WHYLABS_API_KEY as an environment variable in Valohai to keep your keys safe and away from Git.
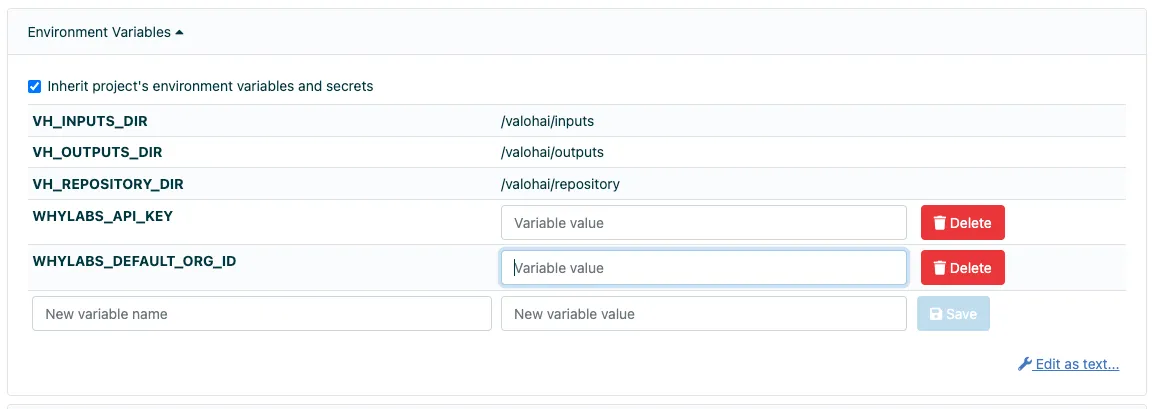
Environment variables can be set for individual executions like shown above. Ideally, you’d set the API key in your Valohai project environment variables, which can be set to be secret.
And now we wrap the data import script with the logger.
# Run whylogs on current data and upload to WhyLabs.
with session.logger(tags={"datasetId": "model-1"}) as ylog:
  file_path = valohai.inputs('attacks').path()
  attacks = pd.read_csv(file_path)
  ylog.log_dataframe(attacks)
When you get back to your browser and WhyLabs, you can observe significant changes in your dataset whenever you update it and run the training module. You can even zoom in with the variables showing some change.
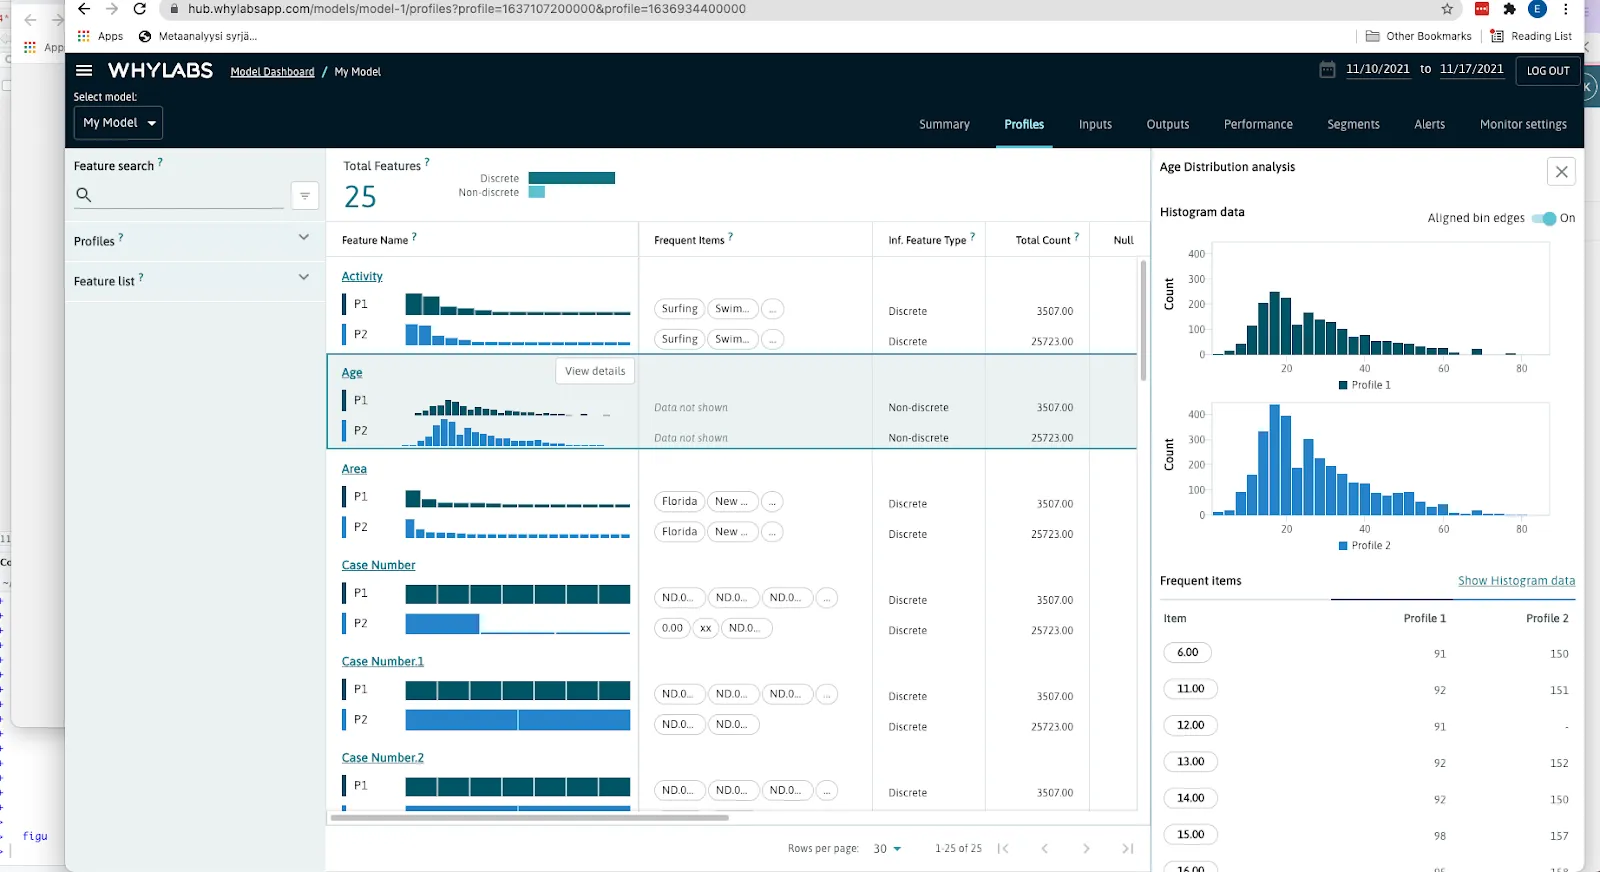
Here’s an example of the same dataset back in 2020 and the same data with the incremental year 2021 and how WhyLabs shows the distribution change between these two.
Awesome, right? You can see from the dashboard that the age distribution of the shark attack victims is similar, but there are more of the younger victims in 2021. With WhyLabs, you can choose the most suitable monitoring baseline for each dataset or model and see automatic alerts when things change too much.
Data logging and profiling in a production system
In ML projects, there are two different, partly parallel processes; the training and the inference.
Training of the model requires a batch of data offline, as we had in the example. But inference often happens online, i.e. in a streaming mode. And when you don’t have heaps of data available for training, you probably want to re-train your model once in a while to gain a more accurate model and expand your training dataset to better represent the world you try to predict.
Let’s play for a bit. Take the shark attacks prediction example: let’s say we have the data until the end of 2020 (a batch, offline) and we have trained the model with that. Let’s also say that it would be crucial for the injury treatment to know a little more accurate guess for the shark species than just a “grey shark looking thing” from a panicked person with injuries at ER in March 2021. Our model could predict the species based on the injuries on this person (streaming, online) fast and medical personnel could give the right kind of treatment and possibly save lives or limbs.
The shark attack is reported afterward by the coast guard, and an expert correctly labels the species. This data point is then added to the training set to make the model even more accurate. This could also be a new type of shark or an injury never seen before, making the model predict a broader range of species.
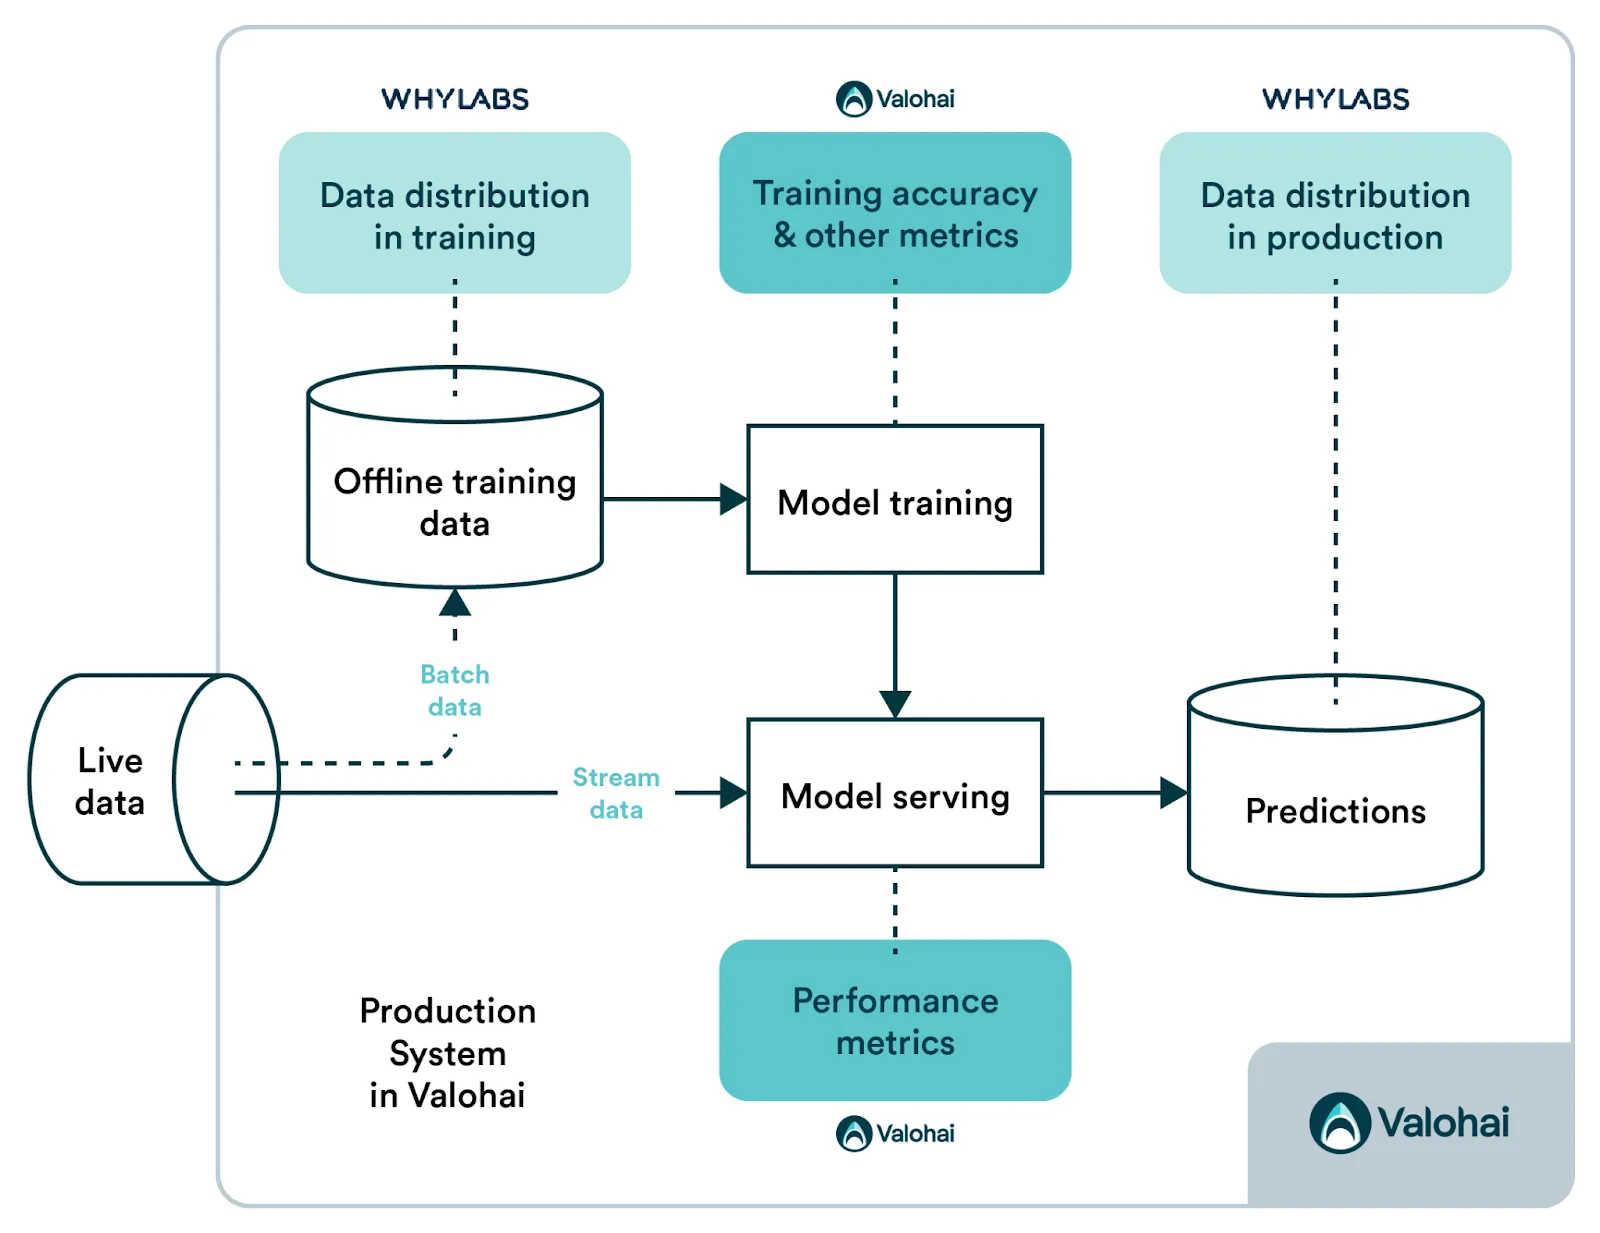
In this example, you can observe and monitor
-
Drift in your training dataset (as shown in the example above)
-
Test set accuracy
-
Inference performance metrics
-
The prediction and the truth
Importance of observability
Monitoring and observability are vital to ensuring that a model stays healthy and performant in production.
Without the ability to inspect the performance and possible hiccups of a model, data scientists and machine learning engineers are flying blind like a pilot without all the beeping things on their dashboard. Monitoring can eliminate costly model failures, reduce time to resolution for data quality bugs, and allow data scientists and machine learning engineers to be proactive about model performance issues. Like Valohai, these systems are built to save time, allowing Data Scientists again to spend their time building, deploying, and improving models.
If you are interested in monitoring your ML model in production, try signing up for the always free WhyLabs Starter edition.
If you are interested in building production pipelines, check out the Valohai MLOps platform.