The increase in computing power, range of models, and automatic finetuning brought endless possibilities in machine learning and processes, and tools for experiment tracking have found their place in most data scientists’ tool belts. Many choices are available, ranging from Excel sheets (please, no more) to sleek web applications with real-time visualizations. One of the most popular alternatives for the task is Weights & Biases.
As you might already know, W&B has an excellent interactive dashboard where you can view your experimentations and track their performance. You can also create collaborative reports for teams to visualize the story behind your experiments. In addition, integrating with your existing code is dead-simple as W&B has an open-source Python library for that.
Sometimes it is hard to combine the world of experimenting and the more dev-oriented world of data science with robust pipelines and modular work. Here’s where Valohai comes in. The platform can complement any existing W&B workflow with the production side of ML. With Valohai, you can efficiently run and automate model training on the cloud, deploy trained models to a Kubernetes cluster and still collect all the training metrics in W&B.
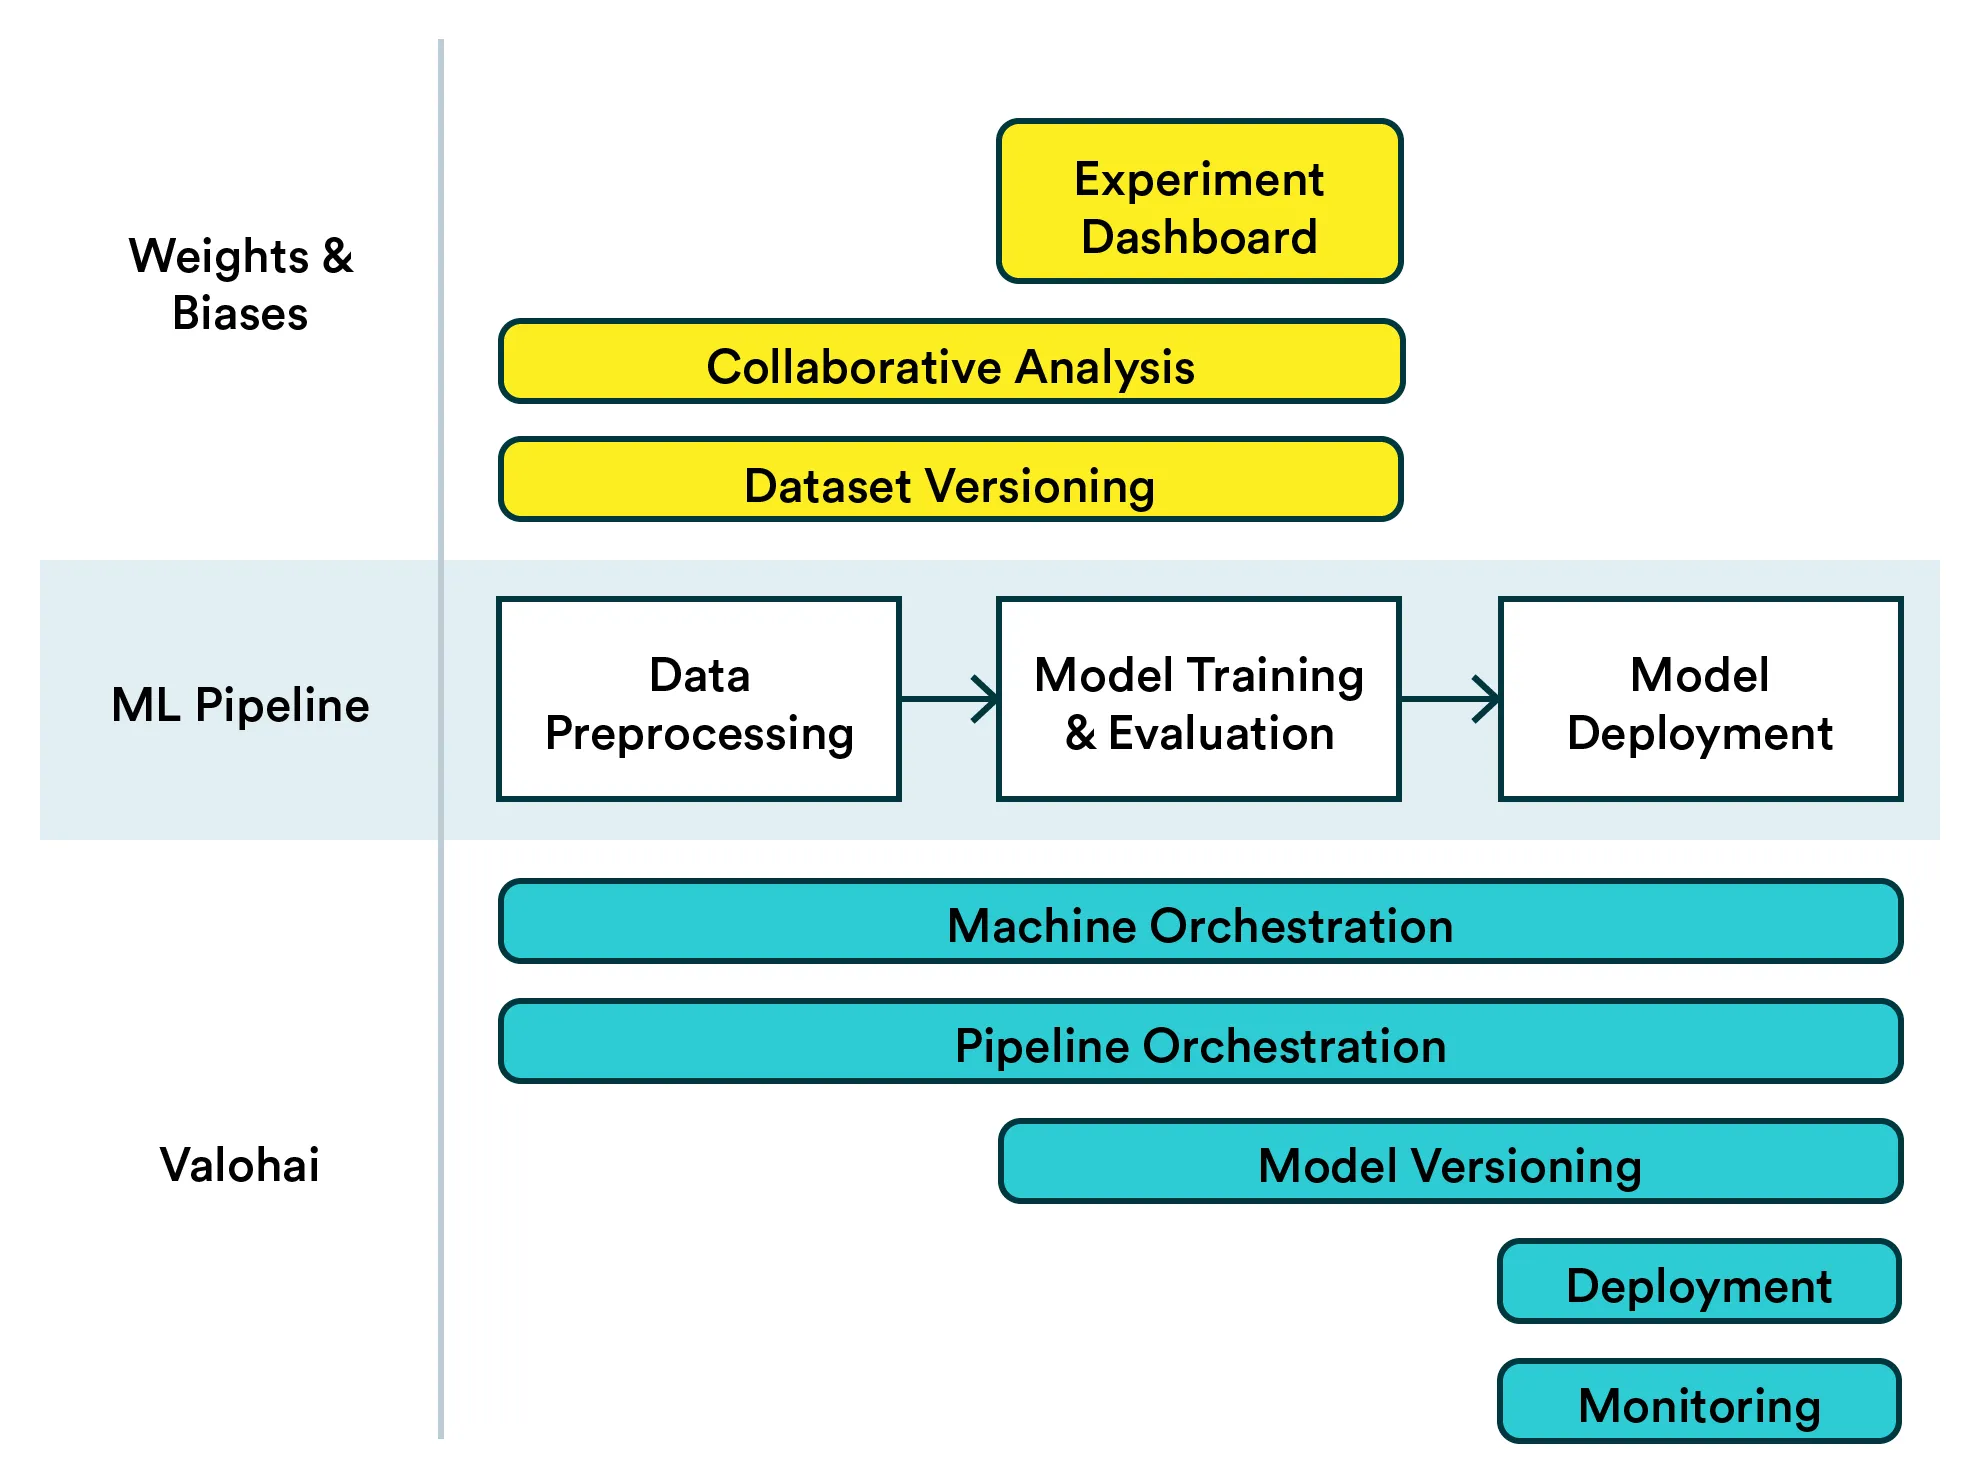
Here’s a visualization of how Weights & Biases can be complemented with Valohai.
Below I have an example for you with a simple, modular pipeline that logs to W&B and runs on Valohai. Skip to the end if you are already using W&B!
Using W&B
If you are already using Weights & Biases, this should look very familiar to you. The important thing to keep in mind is that integrating W&B with Valohai works the same way as with your local experiments. In other words, any of your existing experiments can easily be setup to run on Valohai while keeping the connection with W&B.
Logging your dataset
W&B has an excellent interactive dashboard where you can view your experimentations and track their performance, but in addition to that by using W&B artifacts you can log your dataset (and models if you will) and show the dataset in your report as well. You just add a simple command to create the artifact and then log the dataset
wandb.log_artifact(file_path, name='data_artifact', type='my_dataset')and then log the dataset by simply running
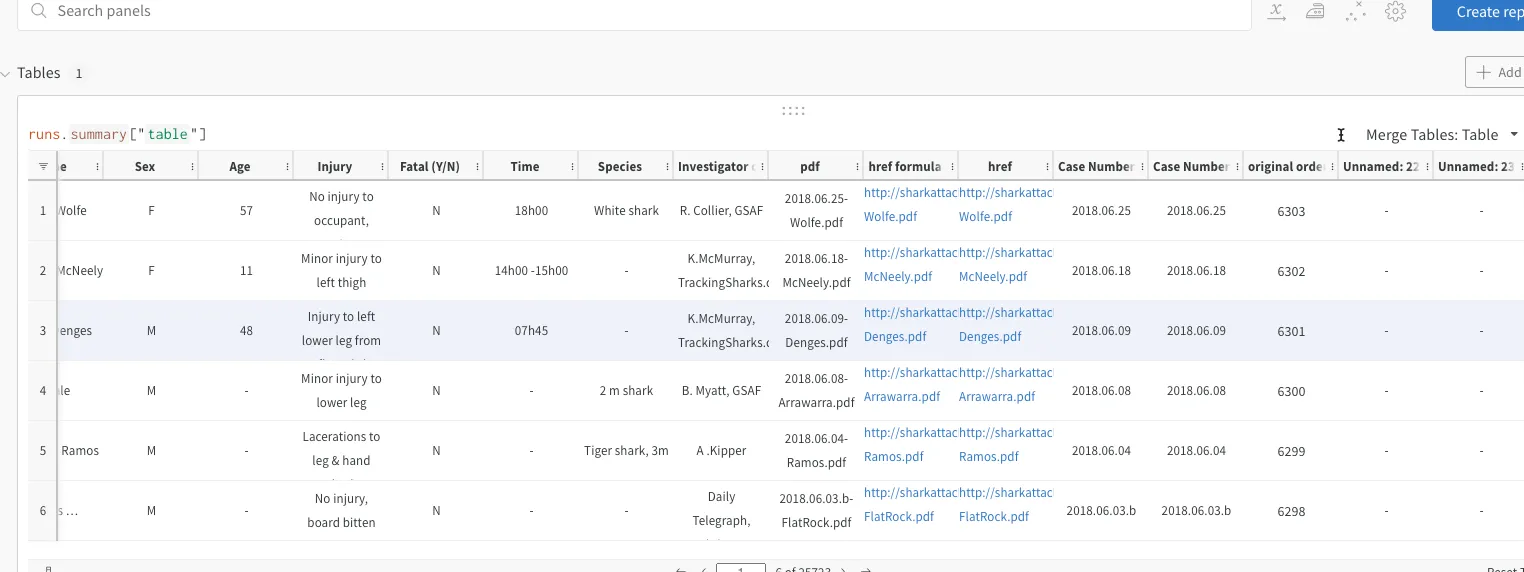
wandb.log({"table": attacks})Here I’m using the same dataset on shark attacks as in this blog post. Running the code and opening your W&B dashboard, you’ll see the data and you can track which version was used.
Experimenting
When you are training the model, perhaps with different subsets of the dataset or with different parameters, you really want to see the differences in performance with one glance.
In this case, we are using Huggingface transformers and it’s is enough to log in to your W&B account, give your project name and add a simple training argument "report_to="wandb"".
wandb.login()
wandb.init(project="huggin-project", entity="eikku")
training_args = TrainingArguments(
output_dir='./results',
num_train_epochs=3,
per_device_train_batch_size=8,
per_device_eval_batch_size=4,
weight_decay=0.01,
eval_steps=10,
logging_steps=10,
report_to="wandb"
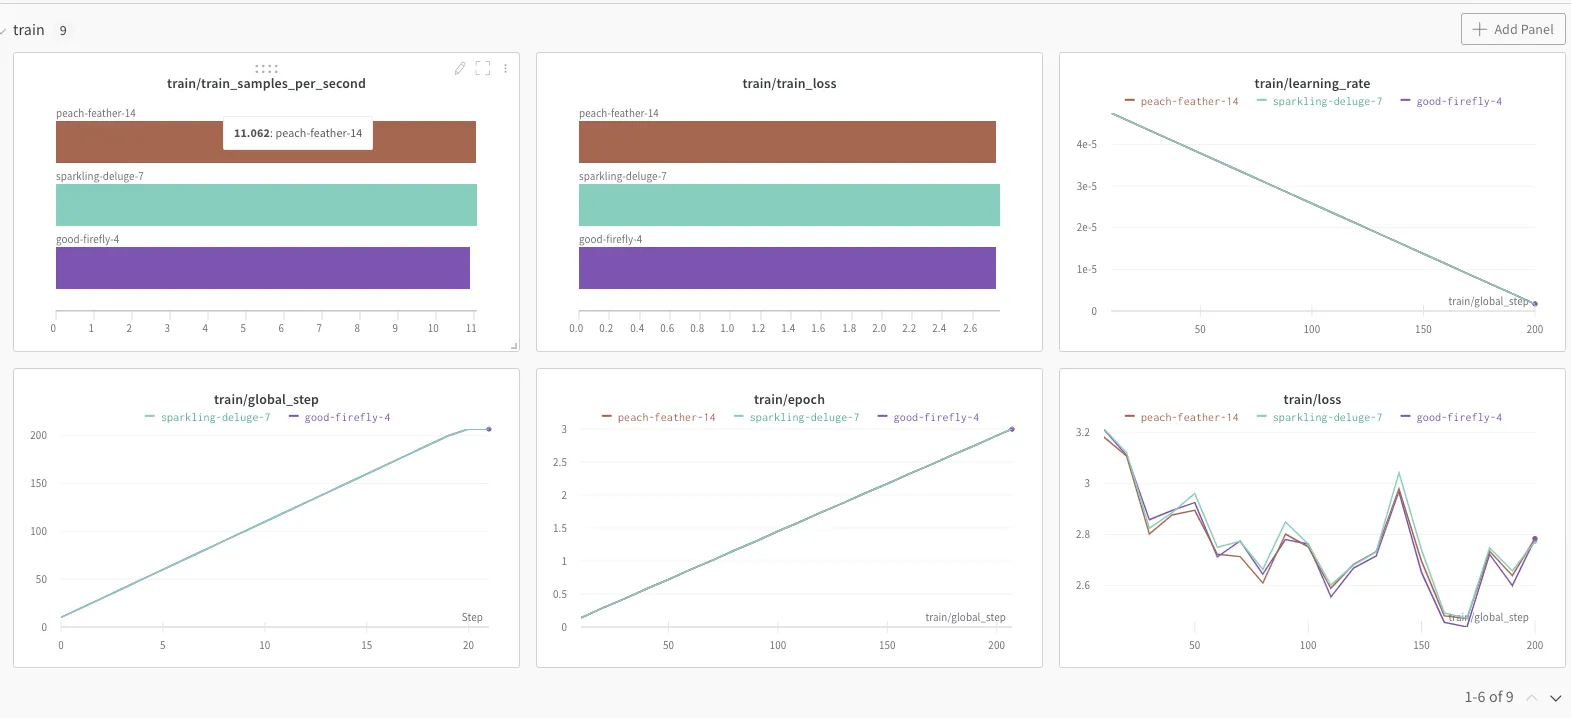
)Again, you’ll see the graphs appear automatically in the dashboard, where you can compare your runs. Here the dataset is so small and runs splitting to train and test don’t differ that much hence the graphs look pretty similar to each other.
Sharing your results via the report
Showing this dashboard to a non Data Scientist colleague wouldn’t necessarily make that much sense, but copy-pasting the figure to a presentation or a document would be quite a burden. Especially when you figure out yet another interesting experiment and have to update it all again. (Yes, you could present it all in a notebook, but we wanted a project ready for production, right?)
With W&B you can create a report explaining your trail of thought which is updated automatically with your graphs of choosing. Share the link and get comments directly to the file! Yay!
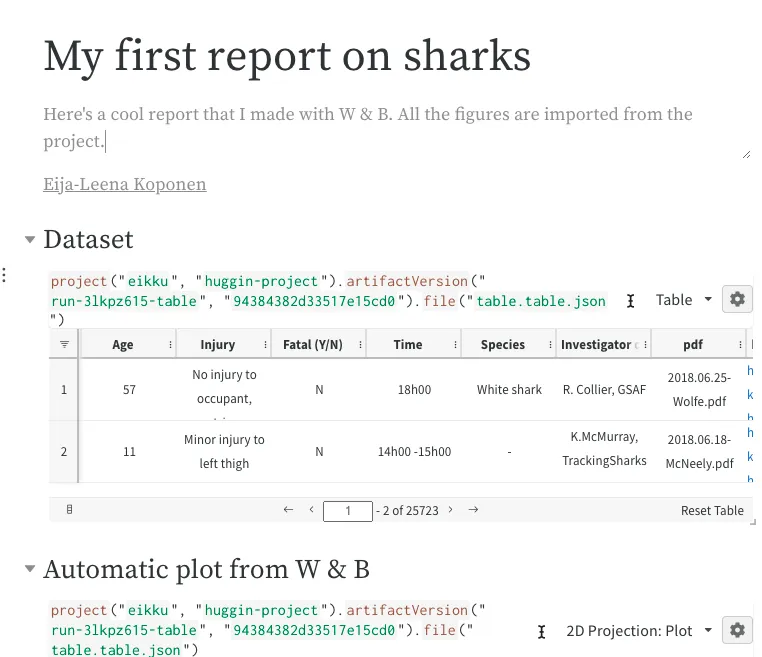
Report done on W&B with a glimpse on the data used in the experiment.
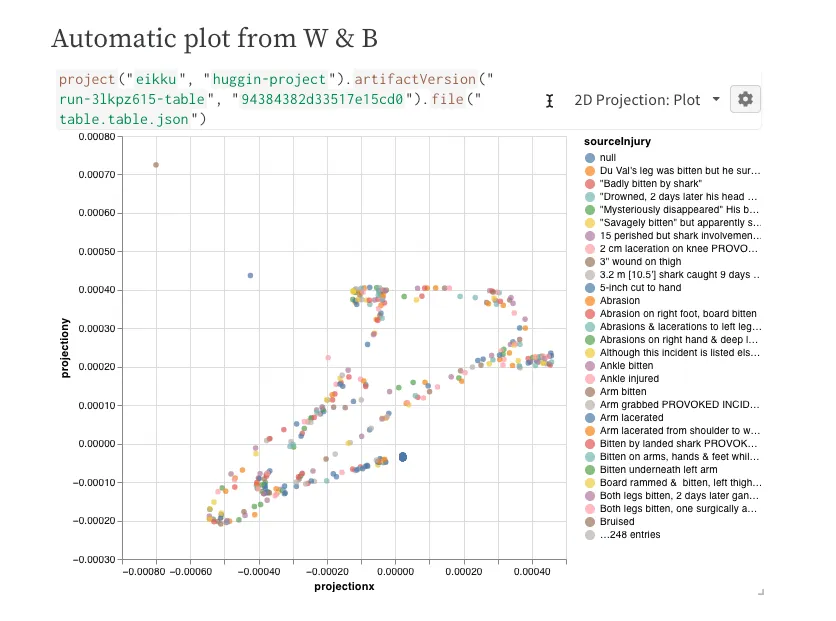
Automatic 2D projection plot done on W&B platform and inserted in the report.
Pipeline in Valohai
Let’s say we intend to turn these experiments into a production ML system that automatically trains the model every time we have a new dataset. There’s no reason we couldn’t have W&B also track these runs and have the same cool reports to share.
I have a four-step pipeline from a previous blog post running with W&B tracking in the example below.
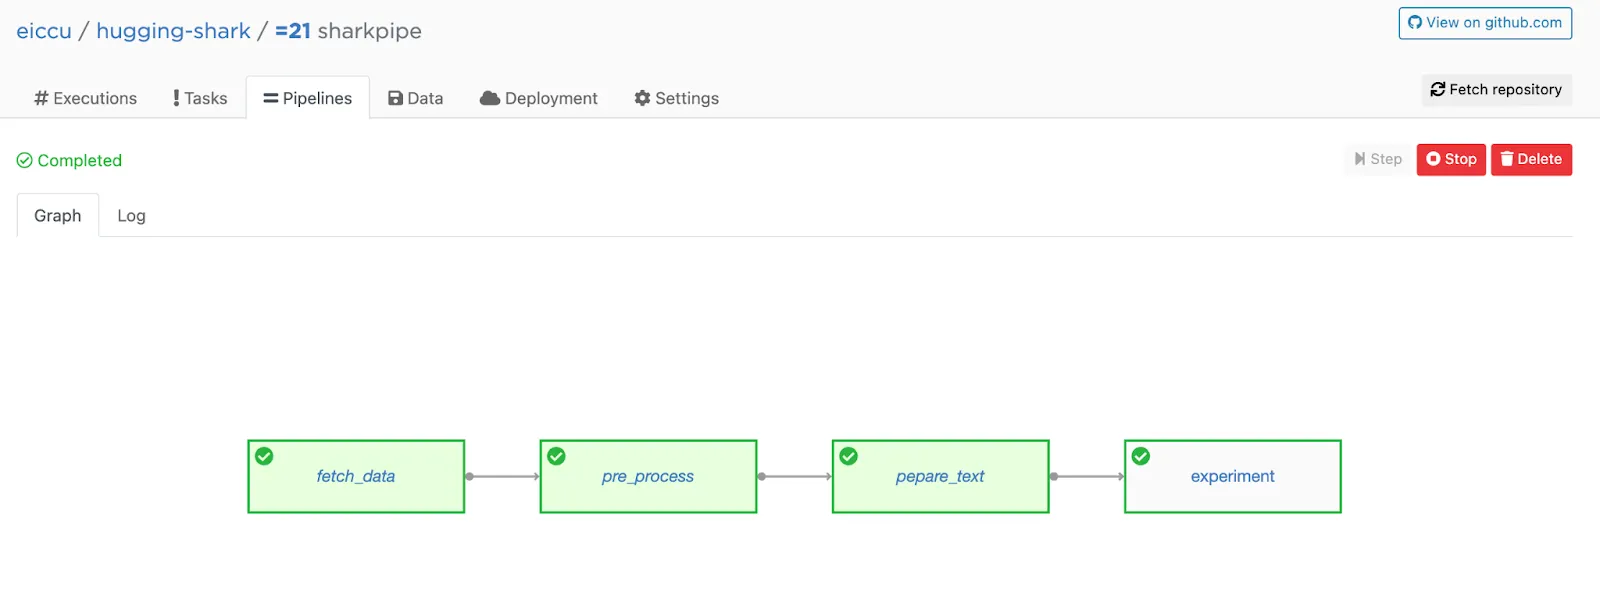
Here’s the pipeline in Valohai. The W&B dataset logging and tracking code are in the experiment step.
If you do something similar with your experiments, think about how to make your pipeline modular rather than a single, long script so it’ll be easier for other people to work with, i.e. see possible bugs and the flow of process.
All my code is stored in a Git repo that I import to my Valohai project. I have created the pipeline with Valohai utils and it is stored as a yaml file in the same repo so Valohai’s platform knows the flow automatically. Then I simply hit run!
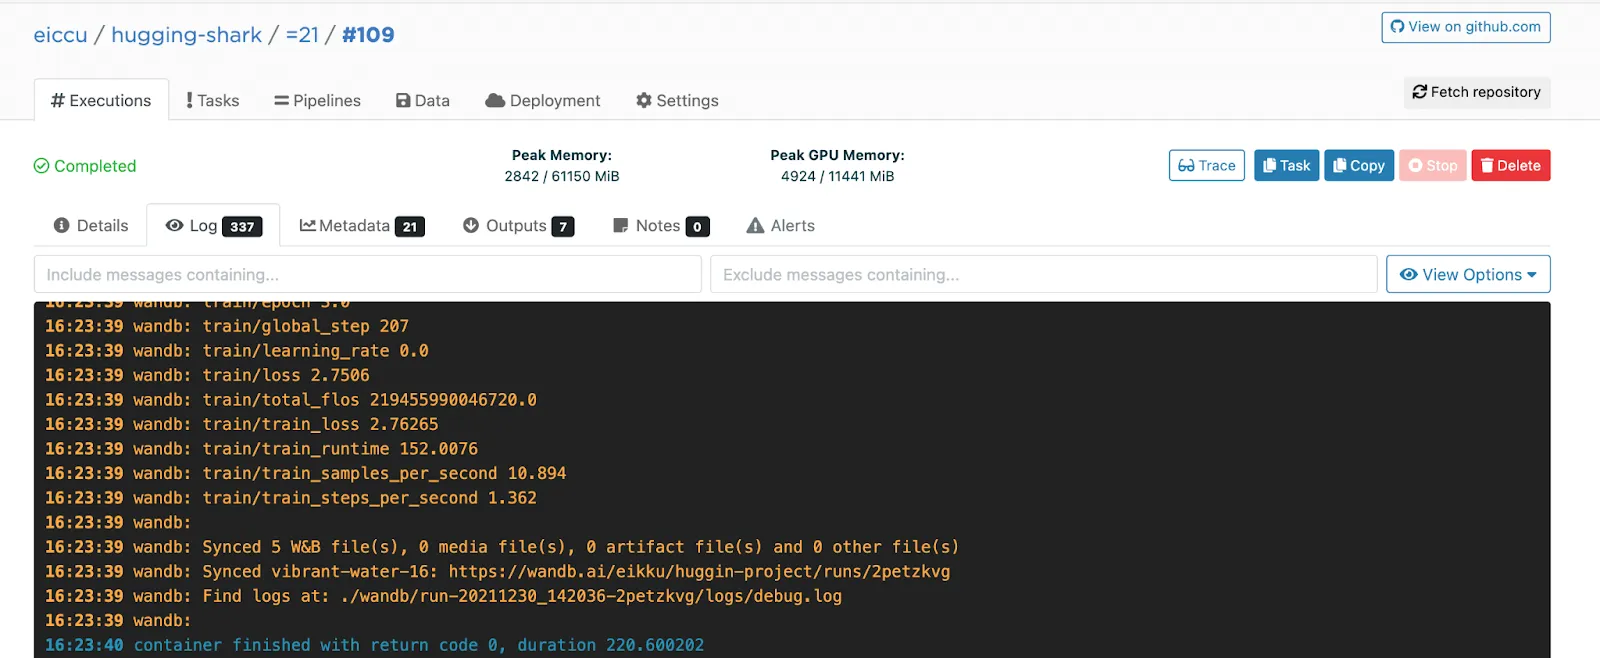
Here’s the log in Valohai telling you that all is synced to W&B.
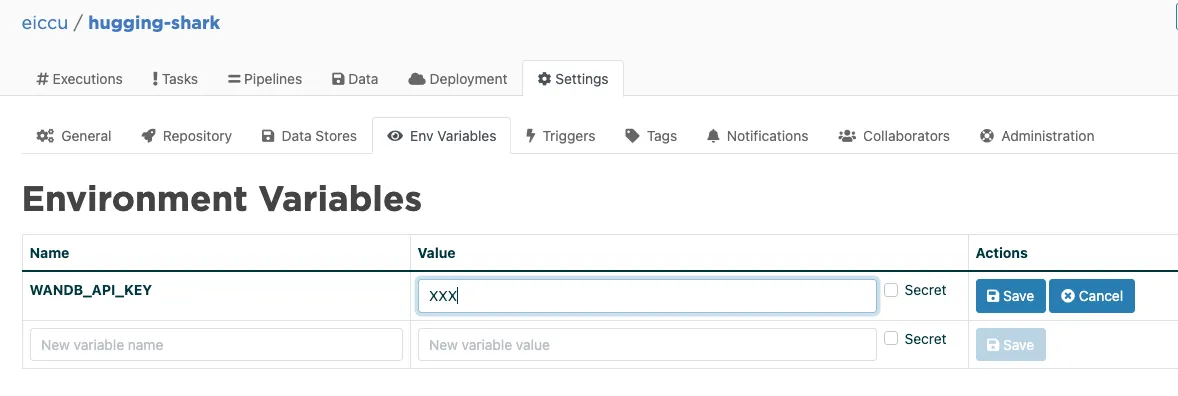
The main difference between running W&B experiments locally and doing the same in a Valohai pipeline is that I use environment variables to pass the API keys for W&B and fetch the desired data from an S3 bucket. You don’t want to store those in Git, right?
Final thoughts
If you are already using W&B for your experimentation, there’s no reason why you wouldn’t have your automated ML pipelines log there as well. The nice thing is that the integration you’ve already done with adding W&B tracking to your code will work just as well in Valohai.
I think this is a win-win situation; you can experiment as you usually do and get the same W&B reports, but you’ll have your code set up on a production-ready system ready for automation and future development.
P.S. You might also want to check my best practices for bridging the gap between experimentation and production.