There are many ways to give instructions to computers, but writing long text-based recipes is one of the most challenging and versatile ways to command our silicon-based colleagues. We call this approach programming, and most data scientists accept that it is a part of their profession, but unfortunately, many underestimate the importance of tooling for it.
The minimum tooling is a simple text editor and the ability to execute your programs. Most operating systems come with an editor (like Notepad in Windows) and the ability to run code (Mac & Linux ship with a c++ compiler). Programming in this minimalistic way went out of fashion in the 90s.
Notebooks (like Jupyter) are often the first contact with programming for any data scientist. There is absolutely nothing wrong with notebooks, and they are fantastic for many use-cases, but they are not the only option for writing programs. Too many get stuck in the vanilla notebook and do not realize what they are missing out on.
There are many tools for writing, refactoring, navigating, debugging, analyzing, and profiling source code. Most tools are stitched together into a single program called IDE (Integrated Development Environment), but some remain as separate stand-alone programs. Most modern IDEs (like VSCode and PyCharm) also have a vibrant plugin ecosystem to extend the built-in capabilities, and the same can be said about the notebooks too.
Code Completion

The programmer needed to memorize all the syntax and methods by heart back in the day. The simple text editor wouldn’t offer any suggestions, and the internet didn’t really exist yet. If you were lucky, you had some programming books on your shelves. These days the best IDEs type the code for you. You start a “sentence,” and the tooling finishes it for you. This is called code completion.
The funny thing is that I always thought code completion is something that only IDEs do and Jupyter doesn’t, but it does! Start writing some code in your notebook and press the TAB key. It’s magic.
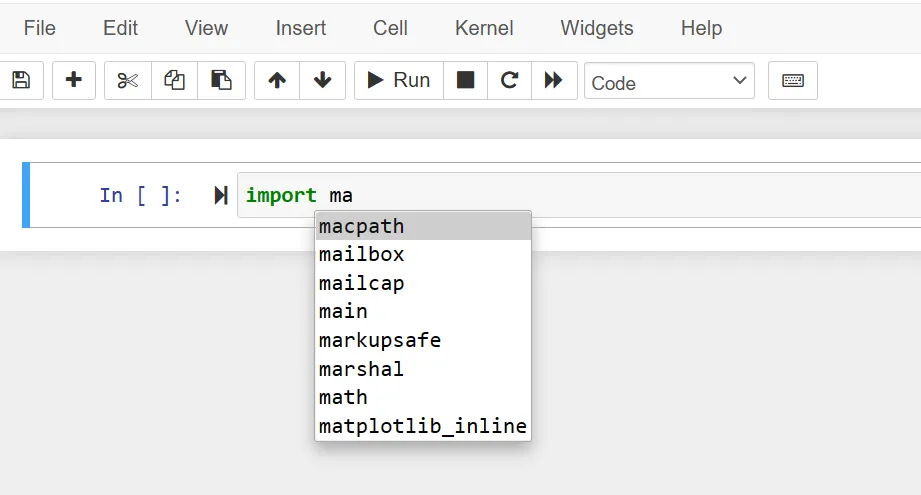
Code completion is a bit smoother in IDEs, though. There is no need to keep firing the TAB key, and the popups offer more context like method signatures, documentation and tips.
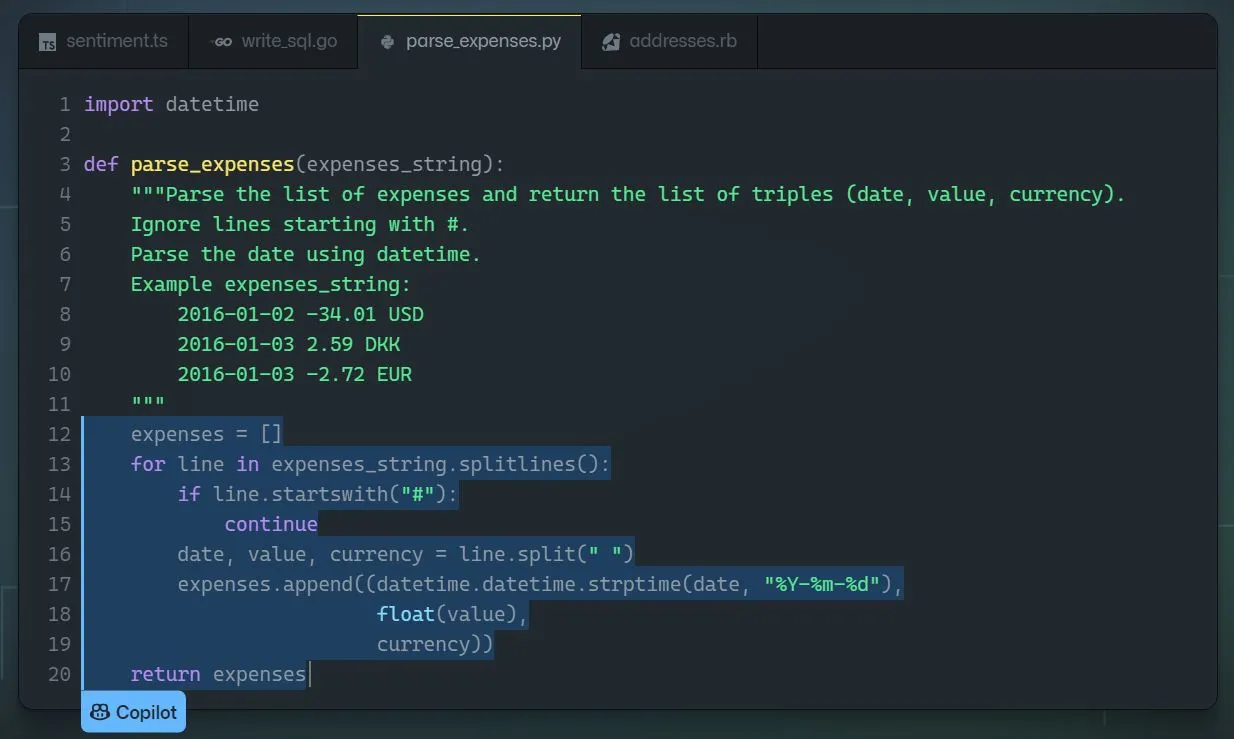
The latest game-changer in code completion is GitHub CoPilot. It is a plugin that doesn’t just finish your “sentences” but offers the entire “chapters” based on your typing. Future programmers will use more and more AI-assisted code editors like GitHub CoPilot to write code, just like I’m using AI-assisted natural language tools like Grammarly to write this article. This progression is inevitable.
The bottom line is that if you have never used code completion before, you should start doing that today. It will change your life!
Refactoring

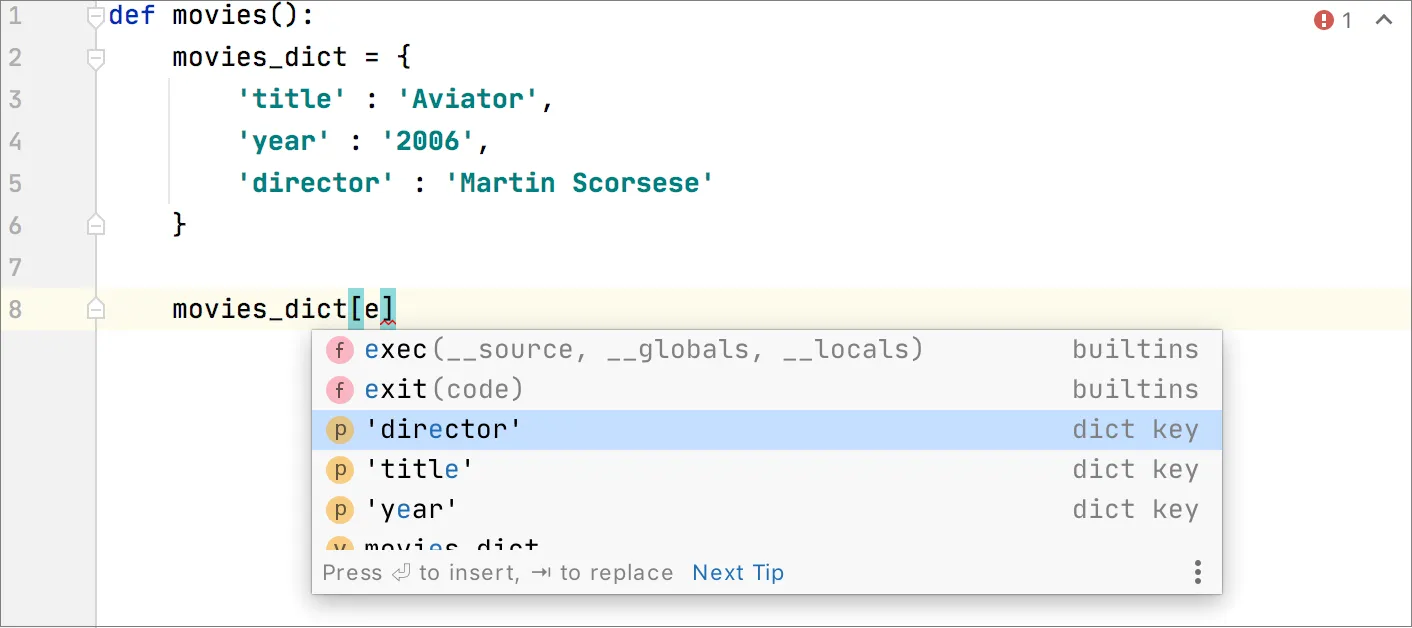
Imagine writing some code and having a variable called table. You use the variable all over the place and later realize that you should’ve named it customers_table instead, as the original name is too vague.
In a Jupyter notebook, you could do a “find and replace” operation, but it only covers a single notebook and can be slightly dangerous. For example, your code will break if you have used the word table in any other context.
Modern IDE is context-aware and truly understands code. It knows what a method is, and the rename operation isn’t just a dummy string operation but safely and robustly renames all usages across the entire codebase.
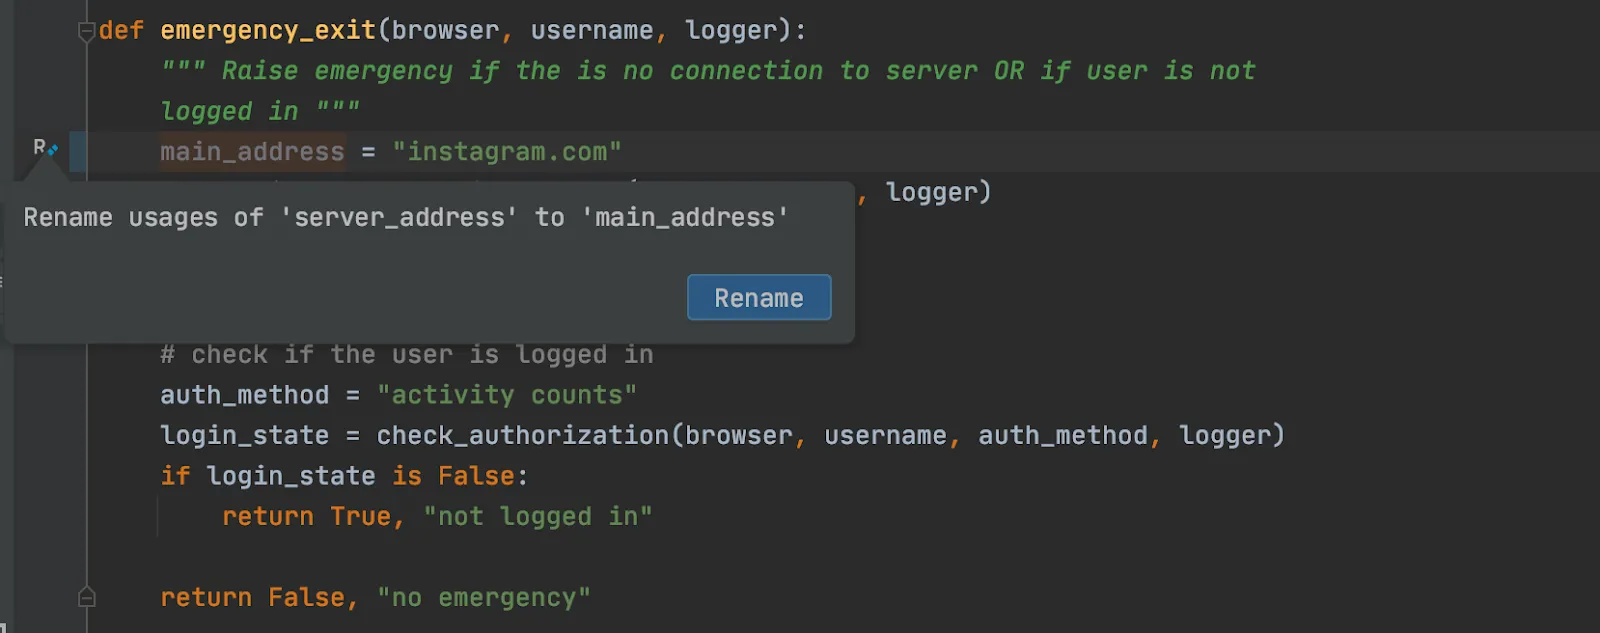
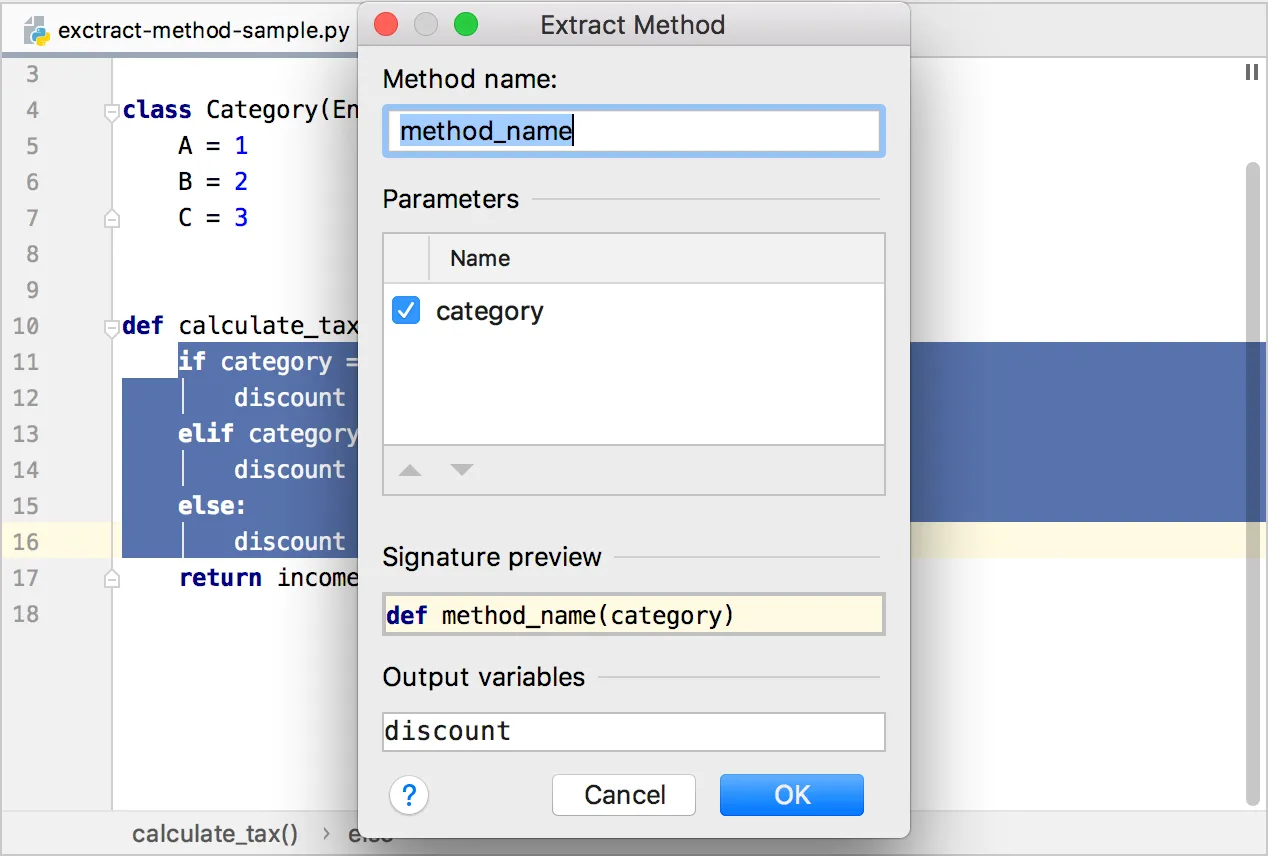
Renaming a method or a variable is a classic, but there are dozens of useful little tools out there like adding imports, extracting methods, auto-updating class initializers, and commenting a large chunk of code to name a few.
If you want more inspiration, check out the documentation for PyCharm & VSCode.
Navigation

Code navigation usually happens when you are figuring things out. You ask questions like, “What does this method do?” and “Where is this variable introduced again?”
One might think that while editing a single notebook with only 50 lines of code, there isn’t much to navigate around, but that is a fallacy. You are always using 3rd party libs like pandas or matplotlib, which have 1000x more code than your notebook.
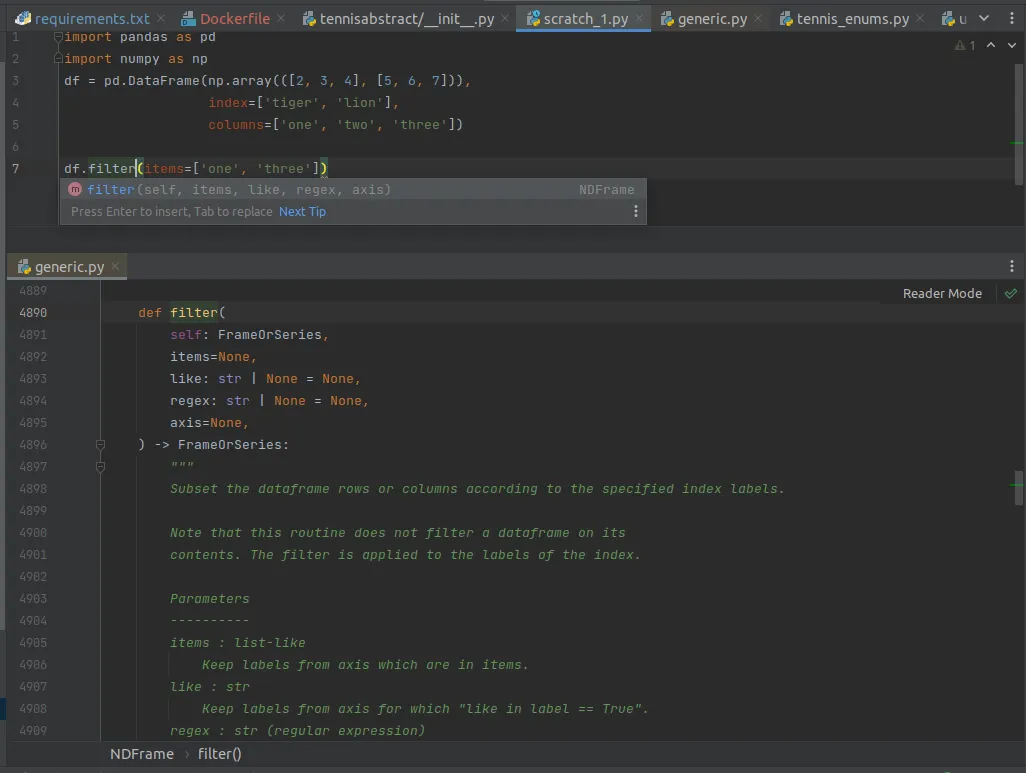
The great thing about using an IDE is that you can dive into the source code of 3rd party package. Want to know what filter() method in Pandas actually does under the hood? Just CTRL+click it and see the implementation yourself! The source code for Pandas is not some next-level voodoo. It is vanilla Python code written by a flesh-and-blood programmer just like you. Don’t be afraid to dive in!
Navigation tools are great at putting everything at your fingertips. Almost every IDE has a generic search tool, which is like having a google search engine for your project. “What was the name of that method again?” and “I need to edit the Dockerfile now” are just hotkey away from getting solved.
Learning all the hotkeys for navigation feels like a burden at first, but jumping around in code becomes second nature once you have internalized them. Navigation is one aspect where the notebooks are unfortunately quite lacking, perhaps due to being designed for a single piece of code and not a large codebase.
Debugger

Let’s face it, every piece of code out there has bugs, and when you are writing something new, your program is broken pretty much all of the time. Debugging is the act of finding out why the darned thing doesn’t do what you expect. Someone once said that debugging is like being the detective in a crime movie where you are also the murderer.
The easy and obvious bugs are squashed just by staring at the code. There is nothing wrong with that. If that doesn’t work, the following approach is running the program with some extra logging, which is fine too. But once we get into the twilight zone of the more bizarre bugs, where nothing seems to make sense, you want to get yourself a debugger.
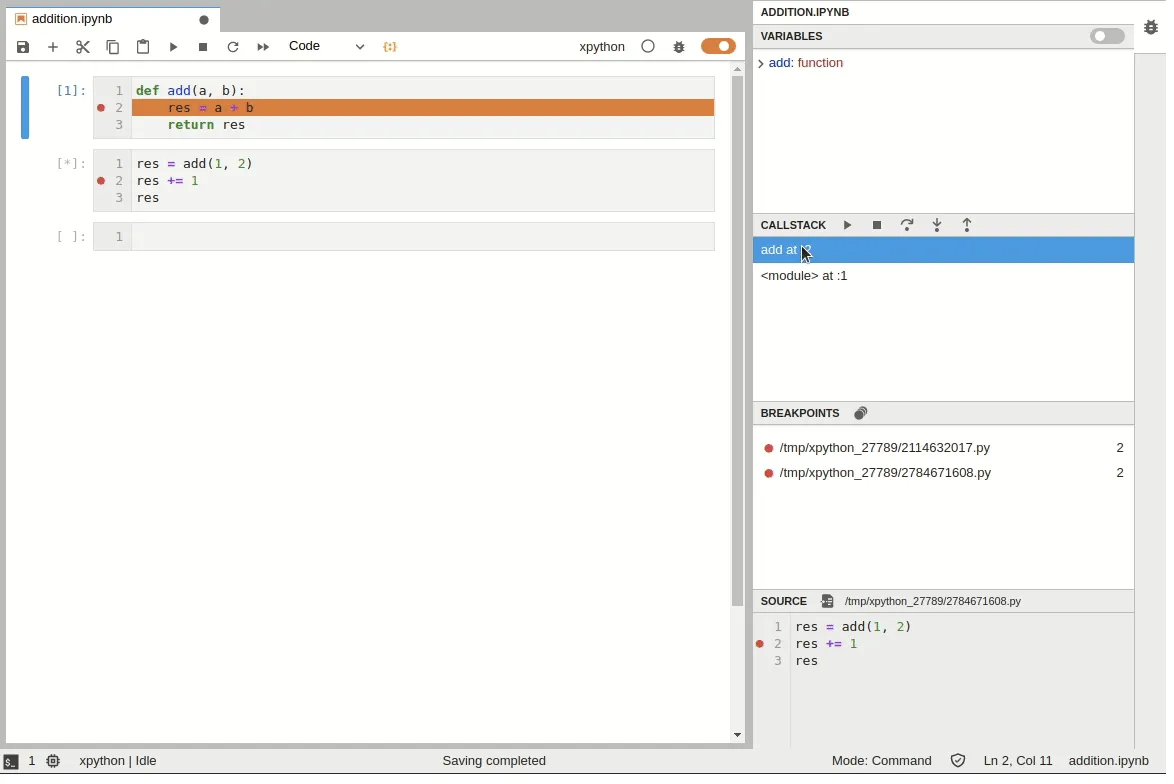
A debugger is a tool that lets you run the program and inspect its execution like you had one of those 10000 frames per second stop-motion cameras. You get to run the program step-by-step, see the value of every variable, and follow the execution down to the rabbit hole of method calls as deep as you need to go. You no longer need to guess what happens. The entire state of the program is at your fingertips.
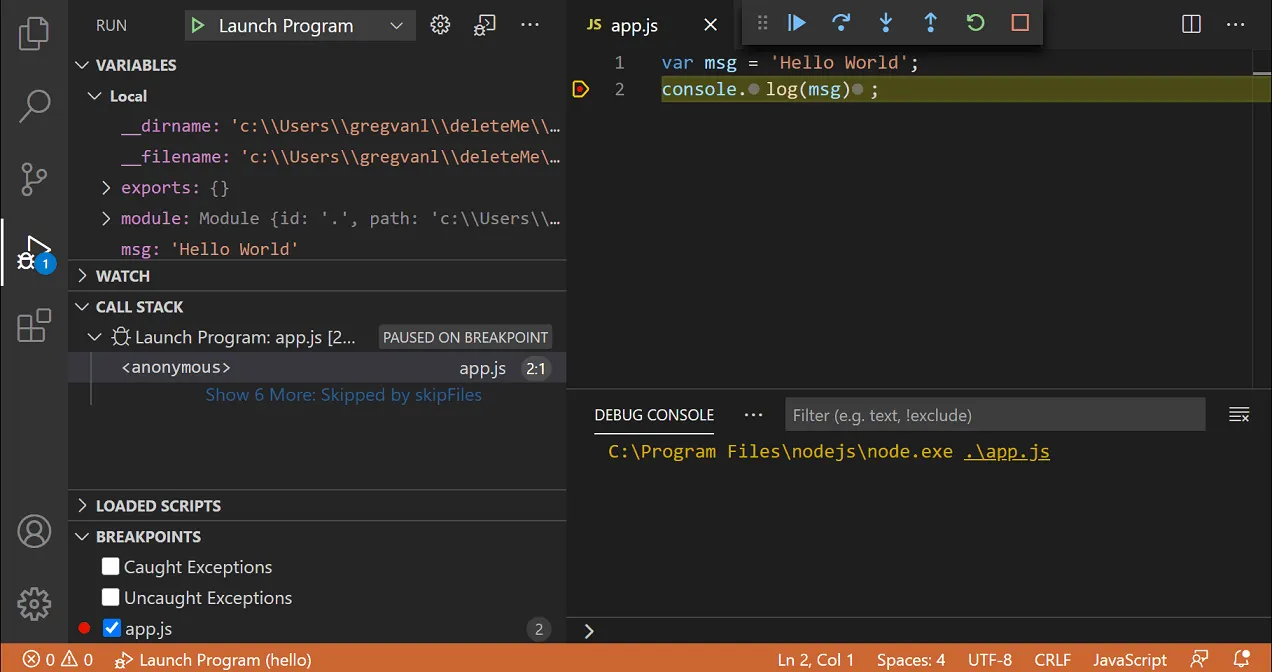
As data scientists, we often run our production code in the cloud, and the most bizarre bugs tend to thrive in these situations. When your production environment (cloud) slightly deviates from your development environment (laptop), you are in for some painful moments. It is where debuggers shine, as they let you debug remotely and reliably compare the two environments.
Python ships with a built-in command-line debugger pdb and Jupyter lets you use it with the %debug magics, but we highly recommend using visual debuggers in the IDEs like PyCharm and VSCode. Jupyterlab also has a visual debugger available as an extension.
A debugger might be an overkill for simple bugs, but the next time you find yourself staring at the code for more than an hour, you might want to consider trying out a debugger. You’d be surprised how much it changes your perspective.
Profiler

The last dish on today’s menu is a profiler. Sometimes you face a situation where your code isn’t meeting the performance requirements. Perhaps the batch preprocessing step takes five hours, and it needs to happen in 30 minutes, or maybe you can only use two gigabytes of memory, and you are currently hoarding eight.
Often we start guessing blindly where the bottleneck is in our code. We might even manually write some ad-hoc logging to time our method calls. Human intuition can be pretty bad at this. We often end up micro-optimizing things that make no difference at all. It is better than nothing, but to be completely honest, you need a profiler.
A profiler is a tool that times everything and can also measure memory usage in great detail. You run your program using a profiler, and you know exactly where the processing power is spent and who hoarded the precious megabytes. Like the debugger in the previous chapter, you no longer need to guess. All the information is at your fingertips.
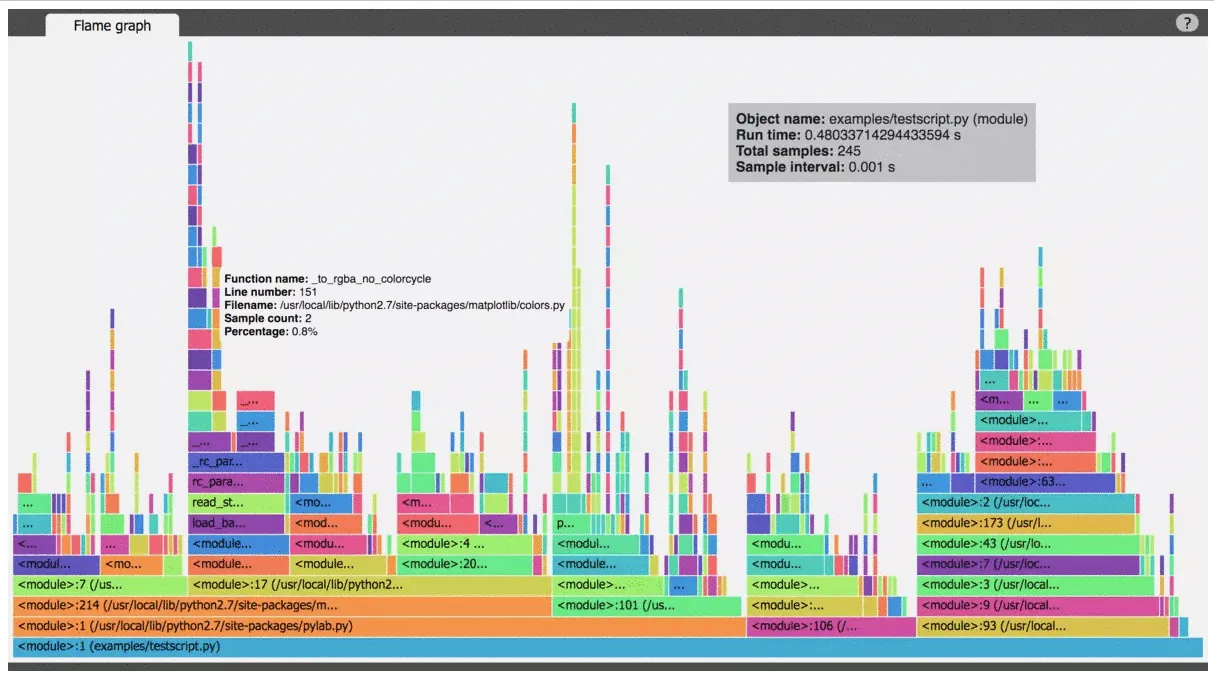
A flame graph visualizing the time spent between different parts of the program
In a typical data science crime scene, the murderer is a 3rd party library like Pandas. It is not that there is anything inherently wrong with it, but they are optimized for ease of use instead of making sure you get the best performance. Complicated things are hidden from you by design. The end result is code that works but is very slow. Profilers are an excellent tool for exposing this when needed. It is not uncommon to get a 100x speed-up by switching one Pandas method to another!
The best profilers are standalone programs or IDE plugins, but all is not lost in the notebook space. Jupyter notebook has built-in magic commands like %time and %prun which can tell you a lot, but are a bit lacking in the user experience when compared to their visual counterparts.
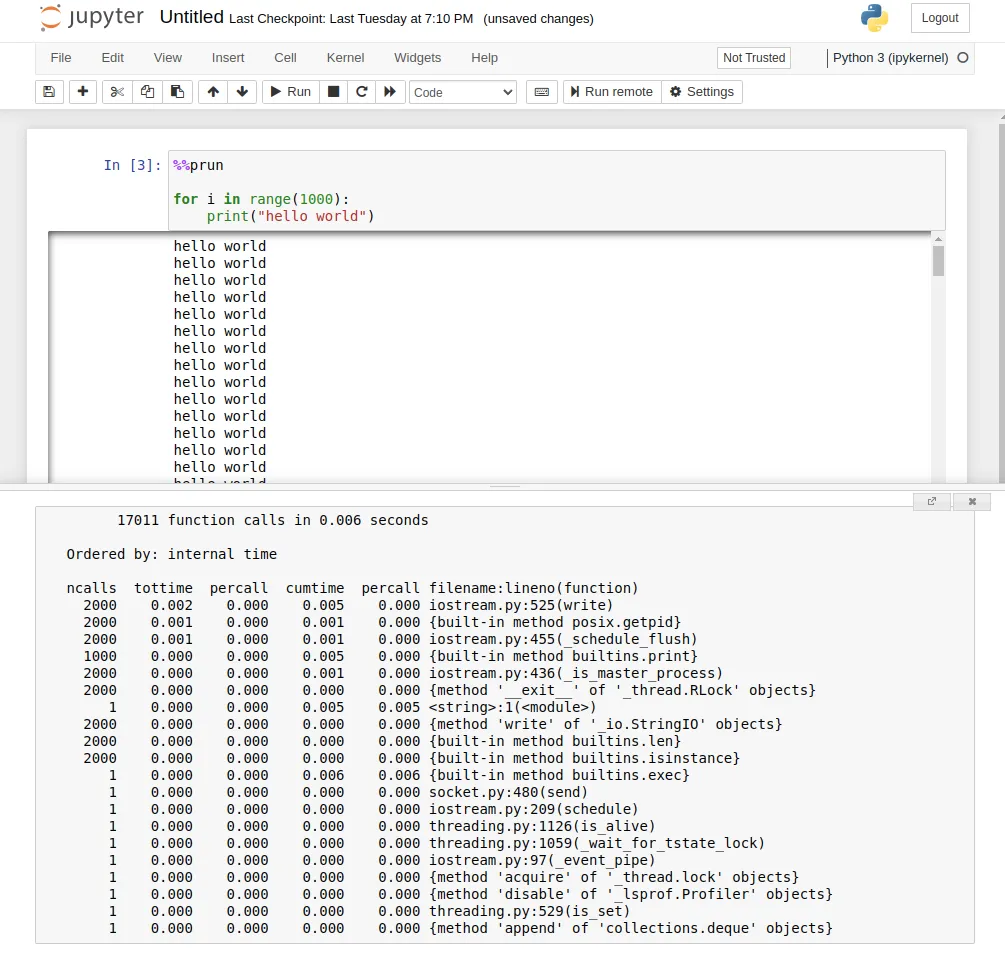
Profiling a cell in Jupyter notebook with %%prun
While debugging can be meaningful without a debugger, optimizing should never be done without a profiler. We are so bad at guessing what makes our programs slow that having a profiler around is the only way to keep us honest while optimizing the performance.
Conclusion

A professional lumberjack doesn’t cut down a forest with a rusty old handsaw, he uses a chainsaw because it gets the job done. In this regard, programming is pretty much like any other job. Programming in a vanilla notebook might be fine for small things, but engineering for production without proper tooling is not recommended, and the gap is widening every day in the wake of new AI-assisted programming tools. I hope this article has inspired data scientists to explore what is out there.
Want more practical engineering tips?
Data scientists are increasingly part of R&D teams and working on production systems, which means the data science and engineering domains are colliding. We want to make it easier for data scientists without an engineering background to learn the fundamental best practices of engineering.
We’ve compiled a guide on engineering topics that we hear data science practitioners think about, including Git, Docker and Python dependencies.
Download the free eBook: Engineering Practices for Data Scientists.